
Navigating the Evolving Landscape: Understanding Unique Users in Google Analytics 4
Last Modified on March 26, 2025
In the dynamic realm of digital analytics, the sheer volume of metrics can quickly overwhelm even seasoned professionals. From total users and active users to new users, returning users, and session counts, the array of data points designed to measure website and application performance is extensive. This abundance often leads to confusion, particularly when attempting to differentiate between metrics and dimensions, and understanding their precise definitions across various analytical tools.
A critical component of any robust web analytics strategy is the accurate measurement of "visitors." However, with the advent of Google Analytics 4 (GA4), the traditional concept of a "unique visitor" has evolved, necessitating a deeper understanding of its contemporary interpretations. This article aims to clarify the intricacies of user identification within GA4, exploring the definitions, tracking mechanisms, reporting locations, best practices, and inherent limitations of what we once simply called "unique visitors."
The Nuance of "Unique": Defining Users in Google Analytics 4
The shift from Universal Analytics (UA) to GA4 marked a significant paradigm change in how user engagement is measured. UA’s "unique visitors" provided a count of individual, de-duplicated users over a specific period. GA4, however, operates on an event-driven data model, fundamentally altering how it identifies and categorizes users. Instead of a direct "unique visitor" metric, GA4 primarily relies on "Total users" and "Active users," concepts that align with its engagement-centric philosophy.
Total Users: The Broadest Measure
Google defines Total users as any unique user who triggers any event on a site or app within a specified date range. The criteria for an event can vary; for instance, a simple page view is a basic event that, once triggered, registers a unique user. More complex custom events, such as a "sign up" event tied to a successful form submission, also contribute to the total user count. This metric offers a comprehensive, albeit broad, view of everyone who interacted with your digital property.

Active Users: Focusing on Engagement
Active users represent a more refined metric, focusing on individuals who have demonstrated a measurable level of engagement with your website or app during the selected period. A user is considered "active" if they have an "engaged session" or if GA4 collects any of the following events: first_visit, session_start, or user_engagement.
The definition of an "engaged session" is crucial here. A session is deemed engaged if it meets any of these conditions:
- It lasts for 10 seconds or longer.
- It includes 2 or more page views or screen views.
- It includes a conversion event.
The user_engagement event itself is designed to fire when a webpage is in focus or an app is in the foreground for at least one second. However, practical observations online sometimes show this event firing just before navigation to another page or after a longer dwell time, indicating a slight discrepancy between official documentation and real-world behavior.
Given these definitions, it’s common for the numbers for "Total users" and "Active users" to be quite close. A basic interaction, such as viewing a page for 10 seconds, would qualify a user as both "total" and "active." While Google Analytics 4 generally favors "Active users" in its standard reports, analysts often use both, acknowledging that the figures are approximations.
Discrepancies between Total and Active users, though often minor, can arise from various factors, including the user identification method, data sampling practices, privacy thresholds, and specific reporting identity settings. Understanding these nuances is paramount to drawing accurate conclusions.

Distinguishing New and Returning Users
Beyond Total and Active users, GA4 also provides metrics for New users and Returning users.
- New users are individuals who have initiated their
first_visitevent within the selected date range. - Returning users are those who have visited your site or app previously and are returning within the specified date range.
A critical nuance here is that a single user can be counted in both "New users" and "Returning users" metrics within the same reporting period, depending on the chosen date range. For example, if a user visits a site for the first time on March 2nd and then returns on March 7th, and your report covers March 1st to March 10th, that individual will be counted in both categories. This highlights the importance of not simply summing these categories to arrive at a total user count, as it would lead to double-counting.
The Mechanics of Identification: How GA4 Tracks Users
GA4’s ability to track users as "unique" across sessions relies on a sophisticated, albeit sometimes limited, system of identifiers.
The Client ID and the _ga Cookie
At the core of GA4’s user identification is the Client ID (CID), a unique, pseudonymous identifier stored in a first-party browser cookie named _ga. When a user visits a site for the first time, GA4 assigns a randomly generated Client ID to them. This ID, typically a long string of numbers (e.g., 1242591205.1741664478), allows GA4 to distinguish between new and returning users on that specific device and browser. The second part of the CID after the period represents the creation timestamp in UNIX format.
By default, the _ga cookie has a 2-year expiration period. However, GA4 allows for customization of this duration, ranging from 0 (session-based) to 25 months, to align with evolving privacy regulations and organizational policies.
The Growing Impact of Privacy and Browser Restrictions
The efficacy of cookie-based tracking has been increasingly challenged by privacy-centric initiatives. Browsers like Apple’s Safari (via Intelligent Tracking Prevention – ITP) and Mozilla’s Firefox (via Enhanced Tracking Protection – ETP) actively limit the lifespan of first-party cookies, often reducing it to as little as 7 days, or even 24 hours in some scenarios. This accelerated expiration means that a user returning after a week might be assigned a new Client ID, artificially inflating "New user" counts and distorting long-term user behavior analysis. This evolving landscape necessitates a more nuanced interpretation of user data.
Client ID vs. User-ID: A Critical Distinction
It’s vital to differentiate the Client ID from a User-ID. While the Client ID is device- and browser-specific, the User-ID is a persistent, non-personally identifiable ID assigned by your organization to a logged-in user. When implemented, User-ID enables GA4 to stitch together a user’s journey across different devices and browsers, offering a truly holistic view of their interactions. Without User-ID implementation, GA4 relies on other signals (like Google Signals and modeling) to attempt cross-device reconciliation, but Client ID remains confined to its original browser context.
Ad Blockers and Consent Mode: Further Challenges
The presence of ad blockers can further impede data collection by preventing the storage of cookies or the firing of analytics tags. Moreover, the increasing adoption of privacy regulations like GDPR and CCPA has led to the implementation of Consent Mode in GA4. This feature adjusts how Google tags behave based on a user’s consent choices regarding cookies. If a user denies consent, GA4 can still collect some aggregated, non-identifying data through pings, but it relies on behavioral modeling to fill in the gaps for users who don’t consent to analytics cookies. This introduces an element of estimation into the user counts, impacting the precision of data, particularly for smaller sites or those with high opt-out rates.
Unearthing Insights: Where to Access User Data in GA4
One of GA4’s strengths is the ubiquity of its user metrics across various reports, providing diverse perspectives on audience engagement. While "Active users" are predominantly featured, "Total users," "New users," and "Returning users" are also readily available.
Key Standard Reports for User Metrics
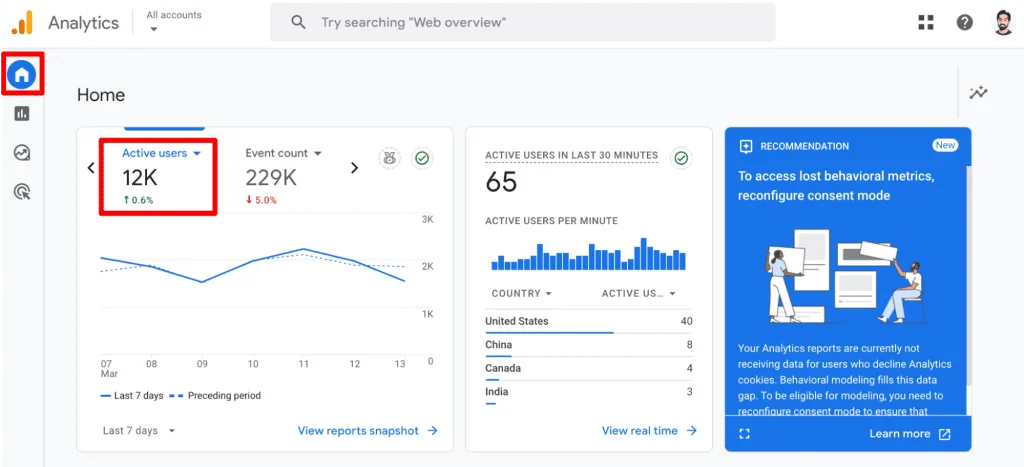
- Home: Provides a quick overview of "Active users" and their comparison to previous periods.
- Reports Snapshot: Offers a summary of "Active" and "New users," alongside rapid insights into geographical distribution and acquisition sources.
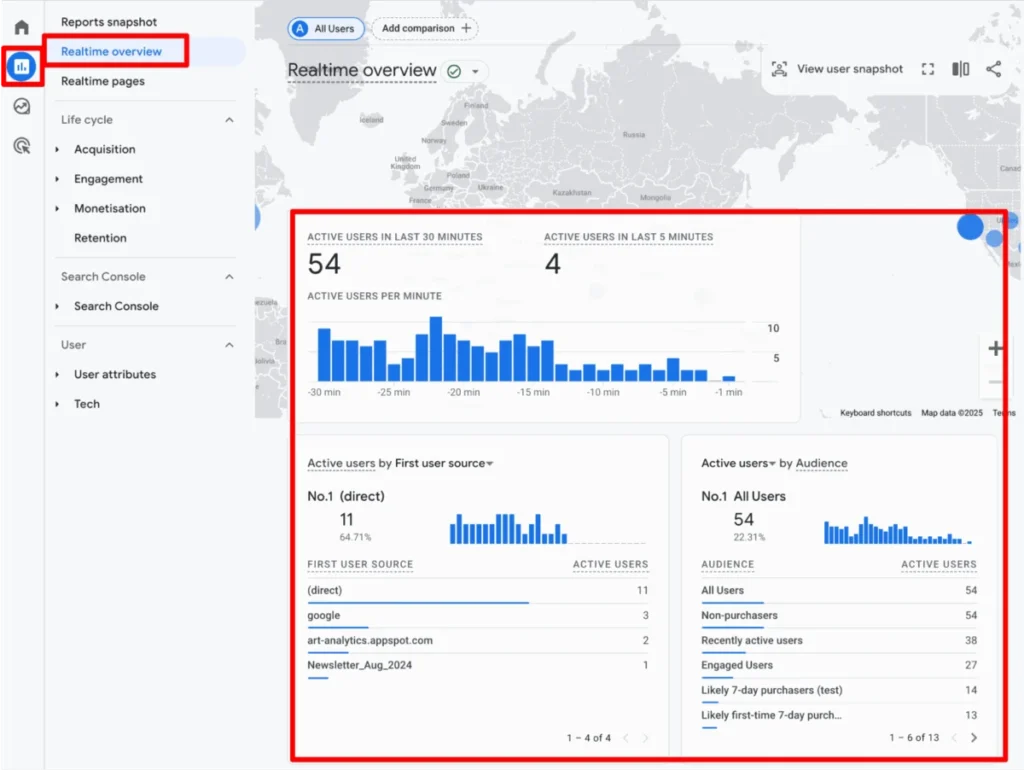
- Realtime Overview & Realtime Pages: Displays "Active users" in the last 30 minutes, showing immediate site activity and which pages they are currently viewing.
- Acquisition Reports (Overview, User acquisition, User acquisition cohorts): Crucial for understanding how users arrive at your site. These reports feature "Total," "New," and "Returning users," helping analyze initial touchpoints and cohort behavior.
- Engagement Reports (Overview, Events, Pages and Screens, Landing pages): Focus on user behavior after arrival. "Active users" are prominent here, alongside metrics like engagement rate, average session duration, and views per active user.
- eCommerce Reports (Purchase and Checkout journey): Track "Active users" through critical conversion funnels, providing insight into purchasing behavior.
- Retention Reports: Specifically designed to analyze user loyalty, featuring "New" and "Returning users" over time to gauge re-engagement.
- User Attributes Reports (Overview, Demographic details, Audiences): Delve into who your users are. "Active" and "New users" are segmented by demographics and audience characteristics.
- Tech Reports (Overview, Tech details): Show "Active" and "New users" based on the devices, browsers, and operating systems they use.
These built-in reports offer a wealth of information. With appropriate permissions, users can customize these reports by adjusting column orders or selecting preferred user metrics.
Customizing Your View: Explorations
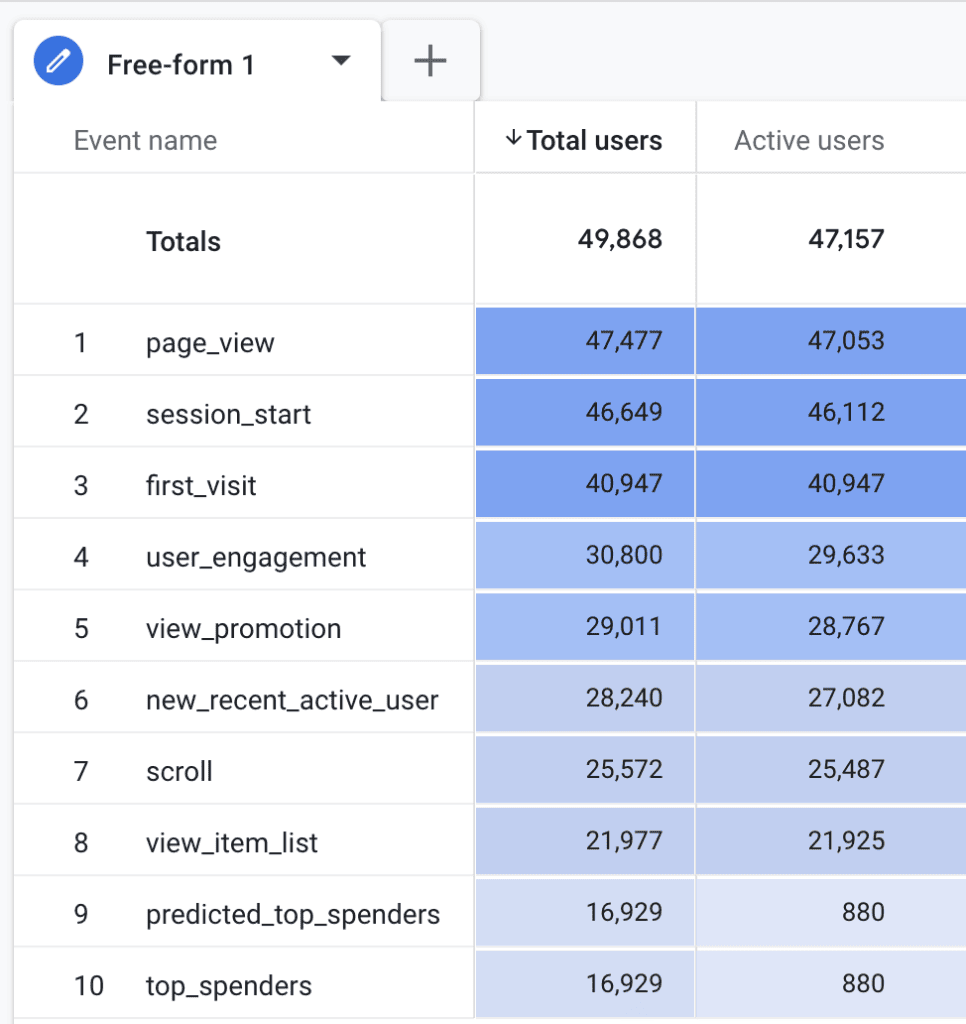
For more granular and bespoke analysis, GA4’s Explorations (formerly "Analysis Hub") provide a flexible environment. Here, all available user metrics can be incorporated into free-form reports, funnel analyses, path explorations, and more. GA4 intelligently grays out or disables metrics that are incompatible with a chosen exploration type, guiding users toward valid data combinations. This flexibility allows analysts to construct highly specific views of user behavior tailored to unique business questions.
Strategic Application: Best Practices for Leveraging User Data
Accurately interpreting and leveraging GA4’s user data requires adherence to several best practices that ensure data integrity and unlock meaningful insights.
Ensuring Data Integrity: The Foundation of Analysis
- Verify Tracking Setup: Duplication is a common pitfall. If GA4 is implemented via multiple methods (e.g., direct installation and Google Tag Manager, or multiple plugins), it can lead to duplicate events and inflated user counts. A rigorous process for tracking setup, including regular audits, is essential to prevent data inaccuracies.
- Monitor Data Regularly: Proactive monitoring for anomalies—sudden dips or spikes in user counts—is crucial. GA4’s "Custom Insights" feature can automate this process by sending email notifications for significant metric changes, allowing for prompt investigation of potential issues like tracking errors or website performance problems.
Navigating Aggregation: When Not to Sum
One of the most critical considerations is understanding the aggregated nature of user metrics. Metrics like "Active users" are already calculated in the backend. Consequently, simply summing user counts across different dimensions or timeframes will almost always lead to inaccurate results. For instance, if a user visits on Friday and again on Sunday within a 7-day reporting period, they will be counted as one unique user for the entire period. However, if you sum the daily user counts for Friday and Sunday, that individual would be counted twice, inflating your total. For true unique user counts across various dimensions, especially when performing complex aggregations, leveraging raw event data in tools like Google BigQuery with the user_pseudo_id is recommended.
Deepening Understanding Through Segmentation
To extract truly actionable insights, segmenting your user data is indispensable. By breaking down your audience based on various dimensions, you can understand how different groups behave. For example:
- Traffic Sources: How do users from organic search, paid ads, or social media differ in engagement and conversion rates?
- Devices: Are mobile users converting differently than desktop users? Are there specific content preferences per device?
- Geographic Location: Are there regional variations in user behavior that could inform localized marketing efforts?
- Content Consumption: Which types of content drive the most engagement or lead to conversions for specific user segments?
Segmentation helps identify the most valuable user groups, optimize their experience, and tailor marketing strategies effectively.

Tailoring Strategies: New vs. Returning User Behavior
Analyzing the distinct behaviors of new and returning users is fundamental to developing targeted strategies:
- New Users: A high volume of new users coupled with low returning rates signals strong acquisition but weak retention. Strategies here should focus on enhancing the initial user experience, nurturing leads through email campaigns, and implementing remarketing efforts to encourage repeat visits.
- Returning Users: A robust base of returning users indicates strong customer loyalty and effective retention. Focus on optimizing their experience, offering personalized content, incentivizing repeat purchases, and identifying upsell opportunities. Monitoring for any decline in returning users can signal potential issues with user experience, content fatigue, or website performance.
The ultimate goal is to convert new users into loyal returning customers, reducing the continuous expenditure on customer acquisition. These best practices transform raw data into strategic intelligence, informing everything from A/B testing hypotheses to overall business development.
Acknowledging Imperfections: Limitations of GA4 User Metrics
Despite its sophistication, GA4’s user metrics are not without limitations. Acknowledging these nuances is vital for accurate interpretation and communication of insights.
Data Sampling: When Your Data Is an Estimate
For properties with very large datasets, GA4 may employ data sampling in certain reports or custom explorations. This means that instead of analyzing all available data, GA4 processes a subset to generate results more quickly. While generally accurate, sampled data is an estimation and might not reflect the absolute truth, especially for highly granular analyses or when detecting subtle trends. For unsampled data, integration with BigQuery is often the solution.
Data Thresholds: Privacy vs. Granularity
To protect user privacy and prevent individuals from being identified, GA4 applies data thresholds. If the number of users in a report is below a certain threshold, or if a specific segment contains too few users, GA4 may suppress data points. This can impact the visibility of data for small segments, making it challenging to analyze niche user groups or events, particularly in explorations.

The Reporting Identity Conundrum
GA4 offers multiple reporting identity options (Device-based, Blended, Observed, Modeling) that determine how it attempts to de-duplicate users across different sessions and devices. The "Blended" option, for instance, combines data from Device ID, User-ID, and Google Signals, and uses modeling to fill gaps. While this aims for a more complete user view, it means that the "truth" of user counts can vary depending on the chosen reporting identity, introducing a degree of estimation and potential inconsistency.
Inherent Client ID Weaknesses
As discussed, the Client ID, being cookie-based, has inherent limitations:
- Cookie Deletion: If a user clears their browser cookies, they will be assigned a new Client ID on their next visit, appearing as a "new user."
- Multiple Devices/Browsers: A single user interacting with your site from a laptop and a smartphone, or across Chrome and Firefox on the same device, will be counted as multiple unique users unless a User-ID is implemented. These scenarios directly inflate "unique" user counts.
Consent Mode and Data Gaps
The implementation of Consent Mode means that if users do not consent to analytics cookies, GA4’s direct data collection is curtailed. While behavioral modeling attempts to infer the behavior of these non-consenting users, the modeled data is an estimation. This introduces potential data gaps and reduces the precision of user counts, especially in regions with strict privacy regulations and high opt-out rates.
These limitations underscore that GA4’s user metrics, while powerful, should always be interpreted with a critical eye, acknowledging that they represent sophisticated approximations rather than absolute, flawless counts.
Conclusion
The journey through understanding unique users in Google Analytics 4 reveals a landscape far more intricate than its Universal Analytics predecessor. We’ve explored GA4’s redefined user metrics – "Total users" and "Active users" – and the critical distinction between "New" and "Returning" users, emphasizing the event-driven philosophy that underpins GA4.

We delved into the technical underpinnings of user identification, examining the role of the Client ID and the _ga cookie, while also acknowledging the profound impact of privacy regulations, browser restrictions, ad blockers, and Consent Mode on data accuracy. The extensive availability of user metrics across 18 standard reports and the flexibility offered by Explorations empower analysts to construct comprehensive views of their audience.
Crucially, we outlined best practices for leveraging this data strategically: ensuring robust tracking, understanding the nuances of aggregation, segmenting users for deeper insights, and tailoring strategies for new versus returning visitors. Finally, we confronted the inherent limitations of GA4’s user data, including sampling, privacy thresholds, reporting identity complexities, and Client ID weaknesses, providing a holistic perspective on what to expect from your analytics.
Mastering these concepts is not merely a technical exercise but a strategic imperative. By truly understanding how GA4 identifies and measures users, digital professionals can move beyond superficial numbers, derive more reliable insights, and make data-driven decisions that foster growth and enhance user experience.
For those eager to further unravel the intricacies of GA4, our detailed post, GA4 User Engagement Made Visual and Simple, offers additional clarity on the user_engagement event and engaged sessions.
How do you navigate the challenges of unique visitor data in GA4? Share your experiences and insights in the comments below!
