
The Science of Social Connection: Mastering Engagement Rate Benchmarks for 2026
In the rapidly evolving landscape of digital marketing, the vanity metric of "follower count" has long been eclipsed by a more potent indicator of brand health: Engagement Rate. As social media algorithms become increasingly sophisticated, prioritizing meaningful interactions over passive views, understanding how to calculate, interpret, and optimize engagement has become the cornerstone of a successful social strategy.

Whether you are a social media manager for an enterprise firm or an independent creator, your engagement rate serves as a litmus test for your content’s resonance. It is not merely a number; it is a signal to both your audience and the platform’s algorithm that your content provides value.

Main Facts: Decoding Engagement Rate
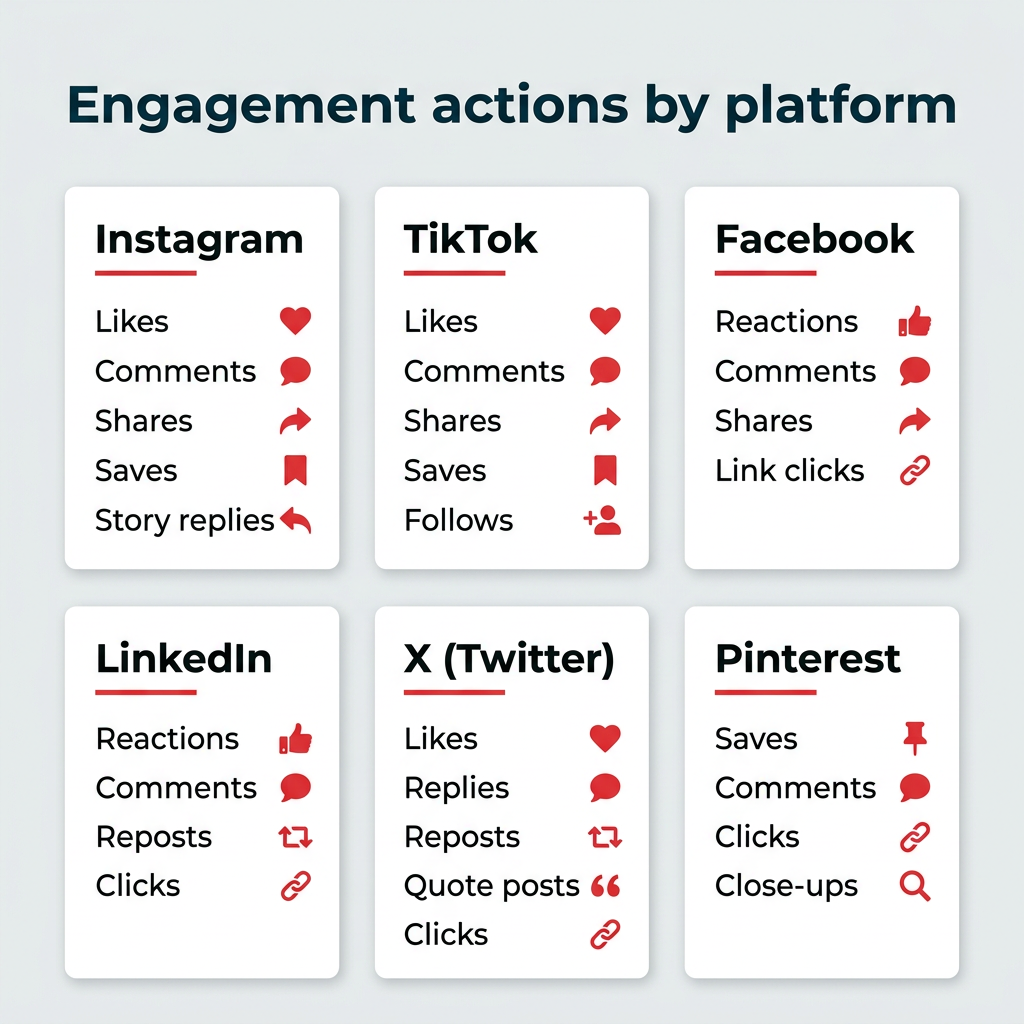
At its core, engagement rate is a metric that quantifies the level of interaction your audience has with your content. While the definition of an "interaction" varies by platform—ranging from a simple "like" on Instagram to a "save" on TikTok or a "repost" on LinkedIn—the principle remains constant: it measures the active participation of your audience relative to your reach, impressions, or total follower base.
Why Engagement Matters
The importance of this metric cannot be overstated for three primary reasons:

- Content Validation: High engagement is the strongest indicator that your content is resonating with your target demographic. It moves beyond passive consumption to active advocacy.
- Algorithmic Favor: Social media platforms are designed to keep users on their apps. By surfacing content that generates high interaction, algorithms reward your brand with increased organic visibility.
- Trust and ROI: For enterprise teams, engagement is a clear proxy for brand loyalty. High interaction rates turn a profile into a digital storefront, providing a clear path to prove Return on Investment (ROI) to leadership.
Chronology of Metrics: How We Arrived Here
The journey of engagement tracking has mirrored the maturity of social platforms themselves. In the early 2010s, "Likes" were the sole currency of success. As platforms introduced more complex features, the metrics followed suit.
- 2015–2018: The rise of video-first content shifted the focus toward view duration and completion rates.
- 2019–2022: The introduction of "Saves" and "Shares" (especially on Instagram and TikTok) forced marketers to pivot away from shallow vanity metrics toward "meaningful interactions."
- 2023–2025: The current era is defined by the "Community-First" model. Platforms now favor deep, threaded conversations in comment sections, leading to the creation of advanced metrics like "Daily Engagement Rate" and "Cost per Engagement" (CPE).
Today, we use a multi-faceted approach to measurement, utilizing six primary formulas to ensure we are comparing "apples to apples" when analyzing cross-platform performance.
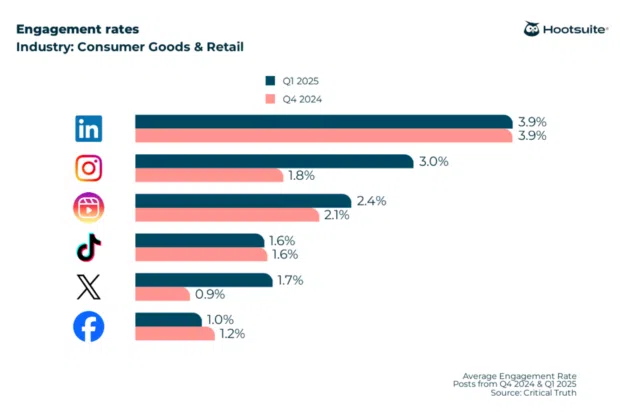
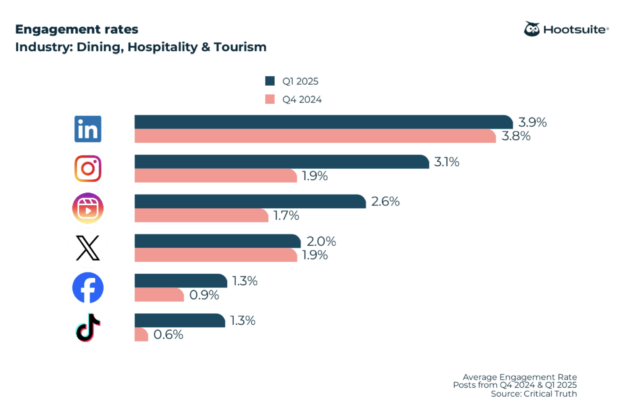
Supporting Data: 2026 Industry Benchmarks
To understand whether your performance is truly "good," you must look at the data. Hootsuite, in partnership with data science agency Critical Truth, analyzed over one million posts to establish the following benchmarks for 2026.
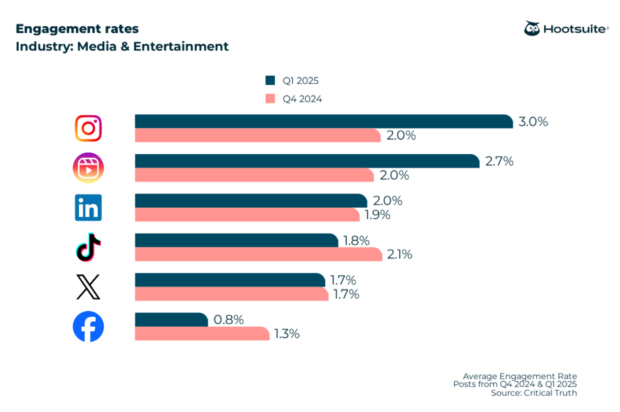
The All-Industry Baseline
Across all industries, the average engagement rate typically hovers between 1% and 5%. Below are the platform-specific averages:
| Platform | Average Engagement Rate |
|---|---|
| 3.0% | |
| Instagram Reels | 2.7% |
| 2.0% | |
| X (Twitter) | 1.8% |
| TikTok | 1.5% |
| 0.8% |
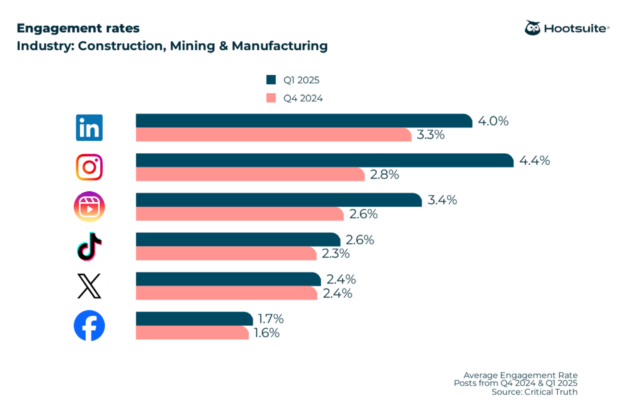
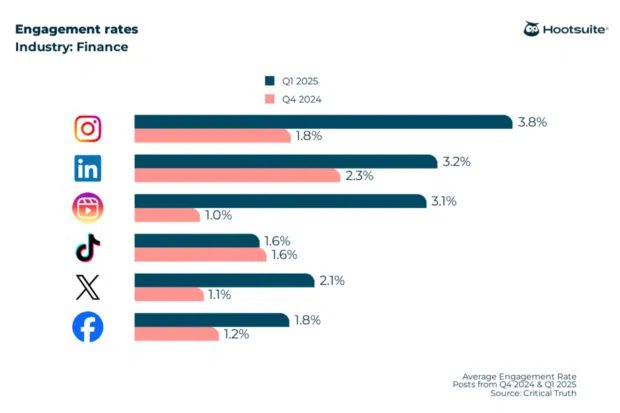
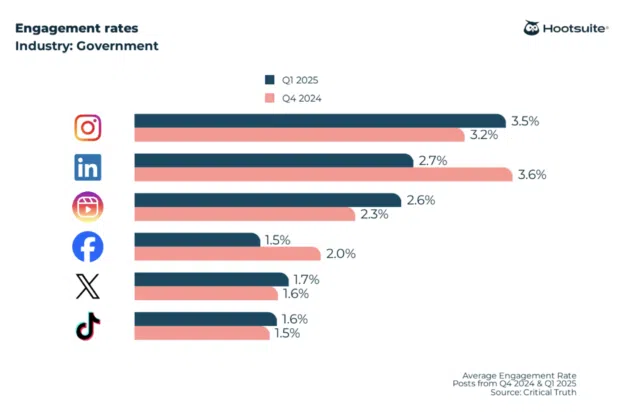
Sector-Specific Insights
- Nonprofit & Construction: These sectors currently lead in engagement, with Instagram rates hitting as high as 4.4%. This suggests that audiences are highly responsive to visual storytelling in these industries.
- Finance & Healthcare: These highly regulated industries see peak performance on LinkedIn and Instagram, with averages around 3.8%, indicating that trust-based content is driving significant interaction.
Note: These figures are meant to serve as a baseline. A "good" rate is one that shows consistent year-over-year growth for your specific brand.

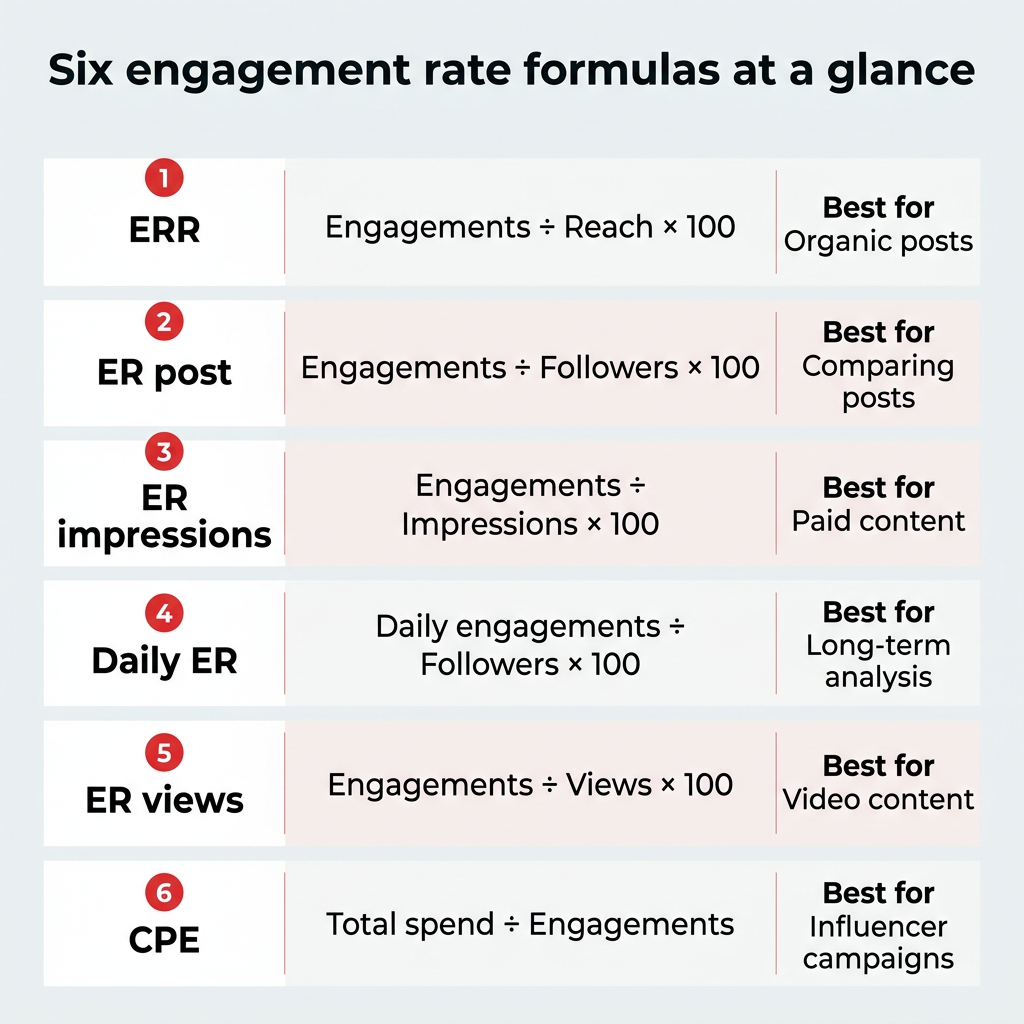
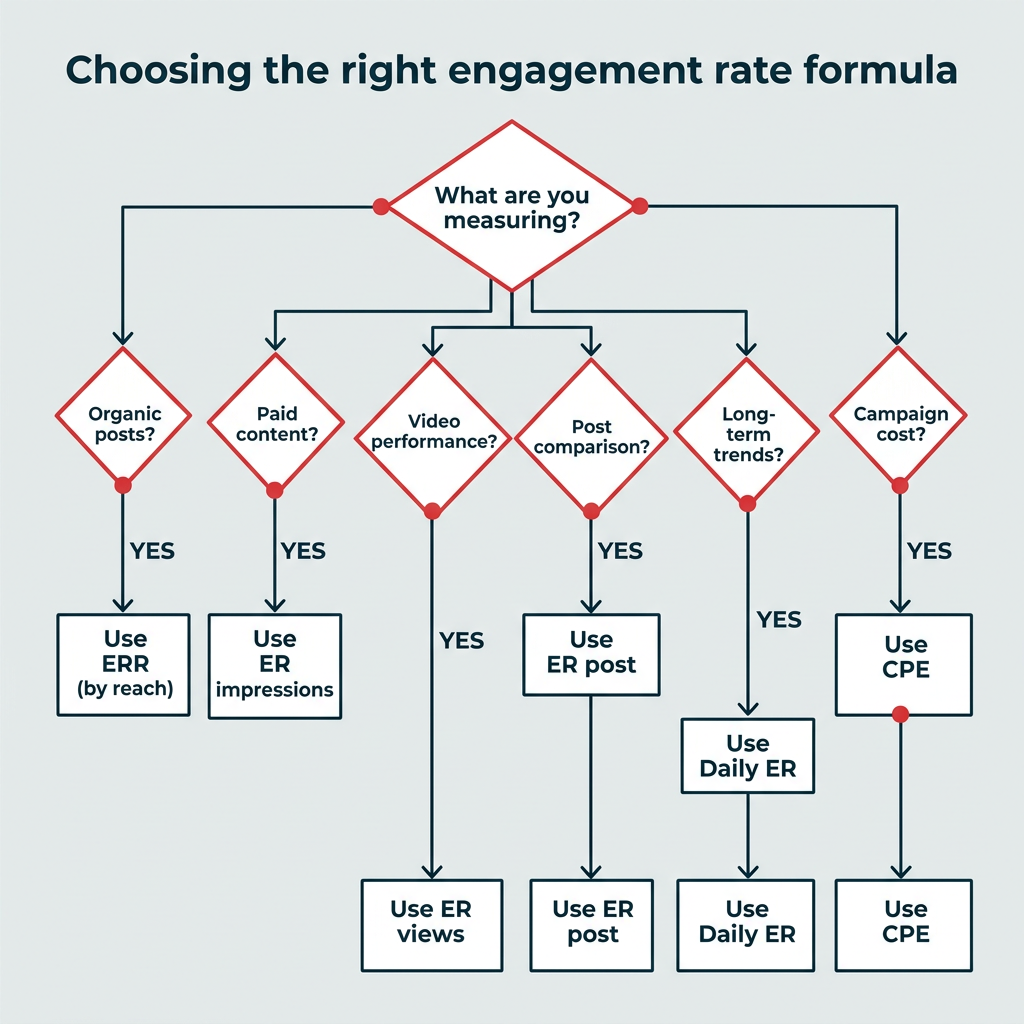
The Six Formulas for Precision Analytics
Choosing the right formula is as important as the data itself. Using the wrong denominator can skew your results significantly.
- Engagement Rate by Reach (ERR): The gold standard for organic content. It measures how many people who actually saw your content decided to interact with it.
- Formula: (Total Engagements / Reach) 100*
- Engagement Rate by Post (ER Post): The best for comparing individual post success. It uses your total follower count as the base, providing a stable baseline.
- Engagement Rate by Impressions (ER Impressions): Ideal for paid campaigns where the same user may see your ad multiple times.
- Daily Engagement Rate (Daily ER): Perfect for long-term health checks. It captures total daily interactions relative to your follower count.
- Engagement Rate by Views (ER Views): Specifically designed for video-first strategies on platforms like TikTok and Reels.
- Cost per Engagement (CPE): The essential metric for influencer marketing, measuring the cost-efficiency of every interaction generated by your spend.
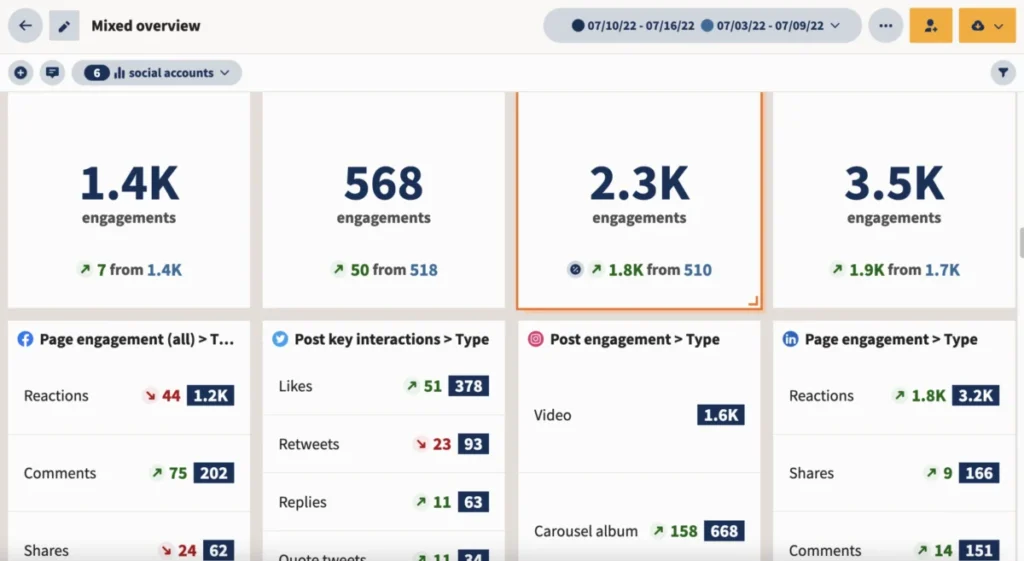
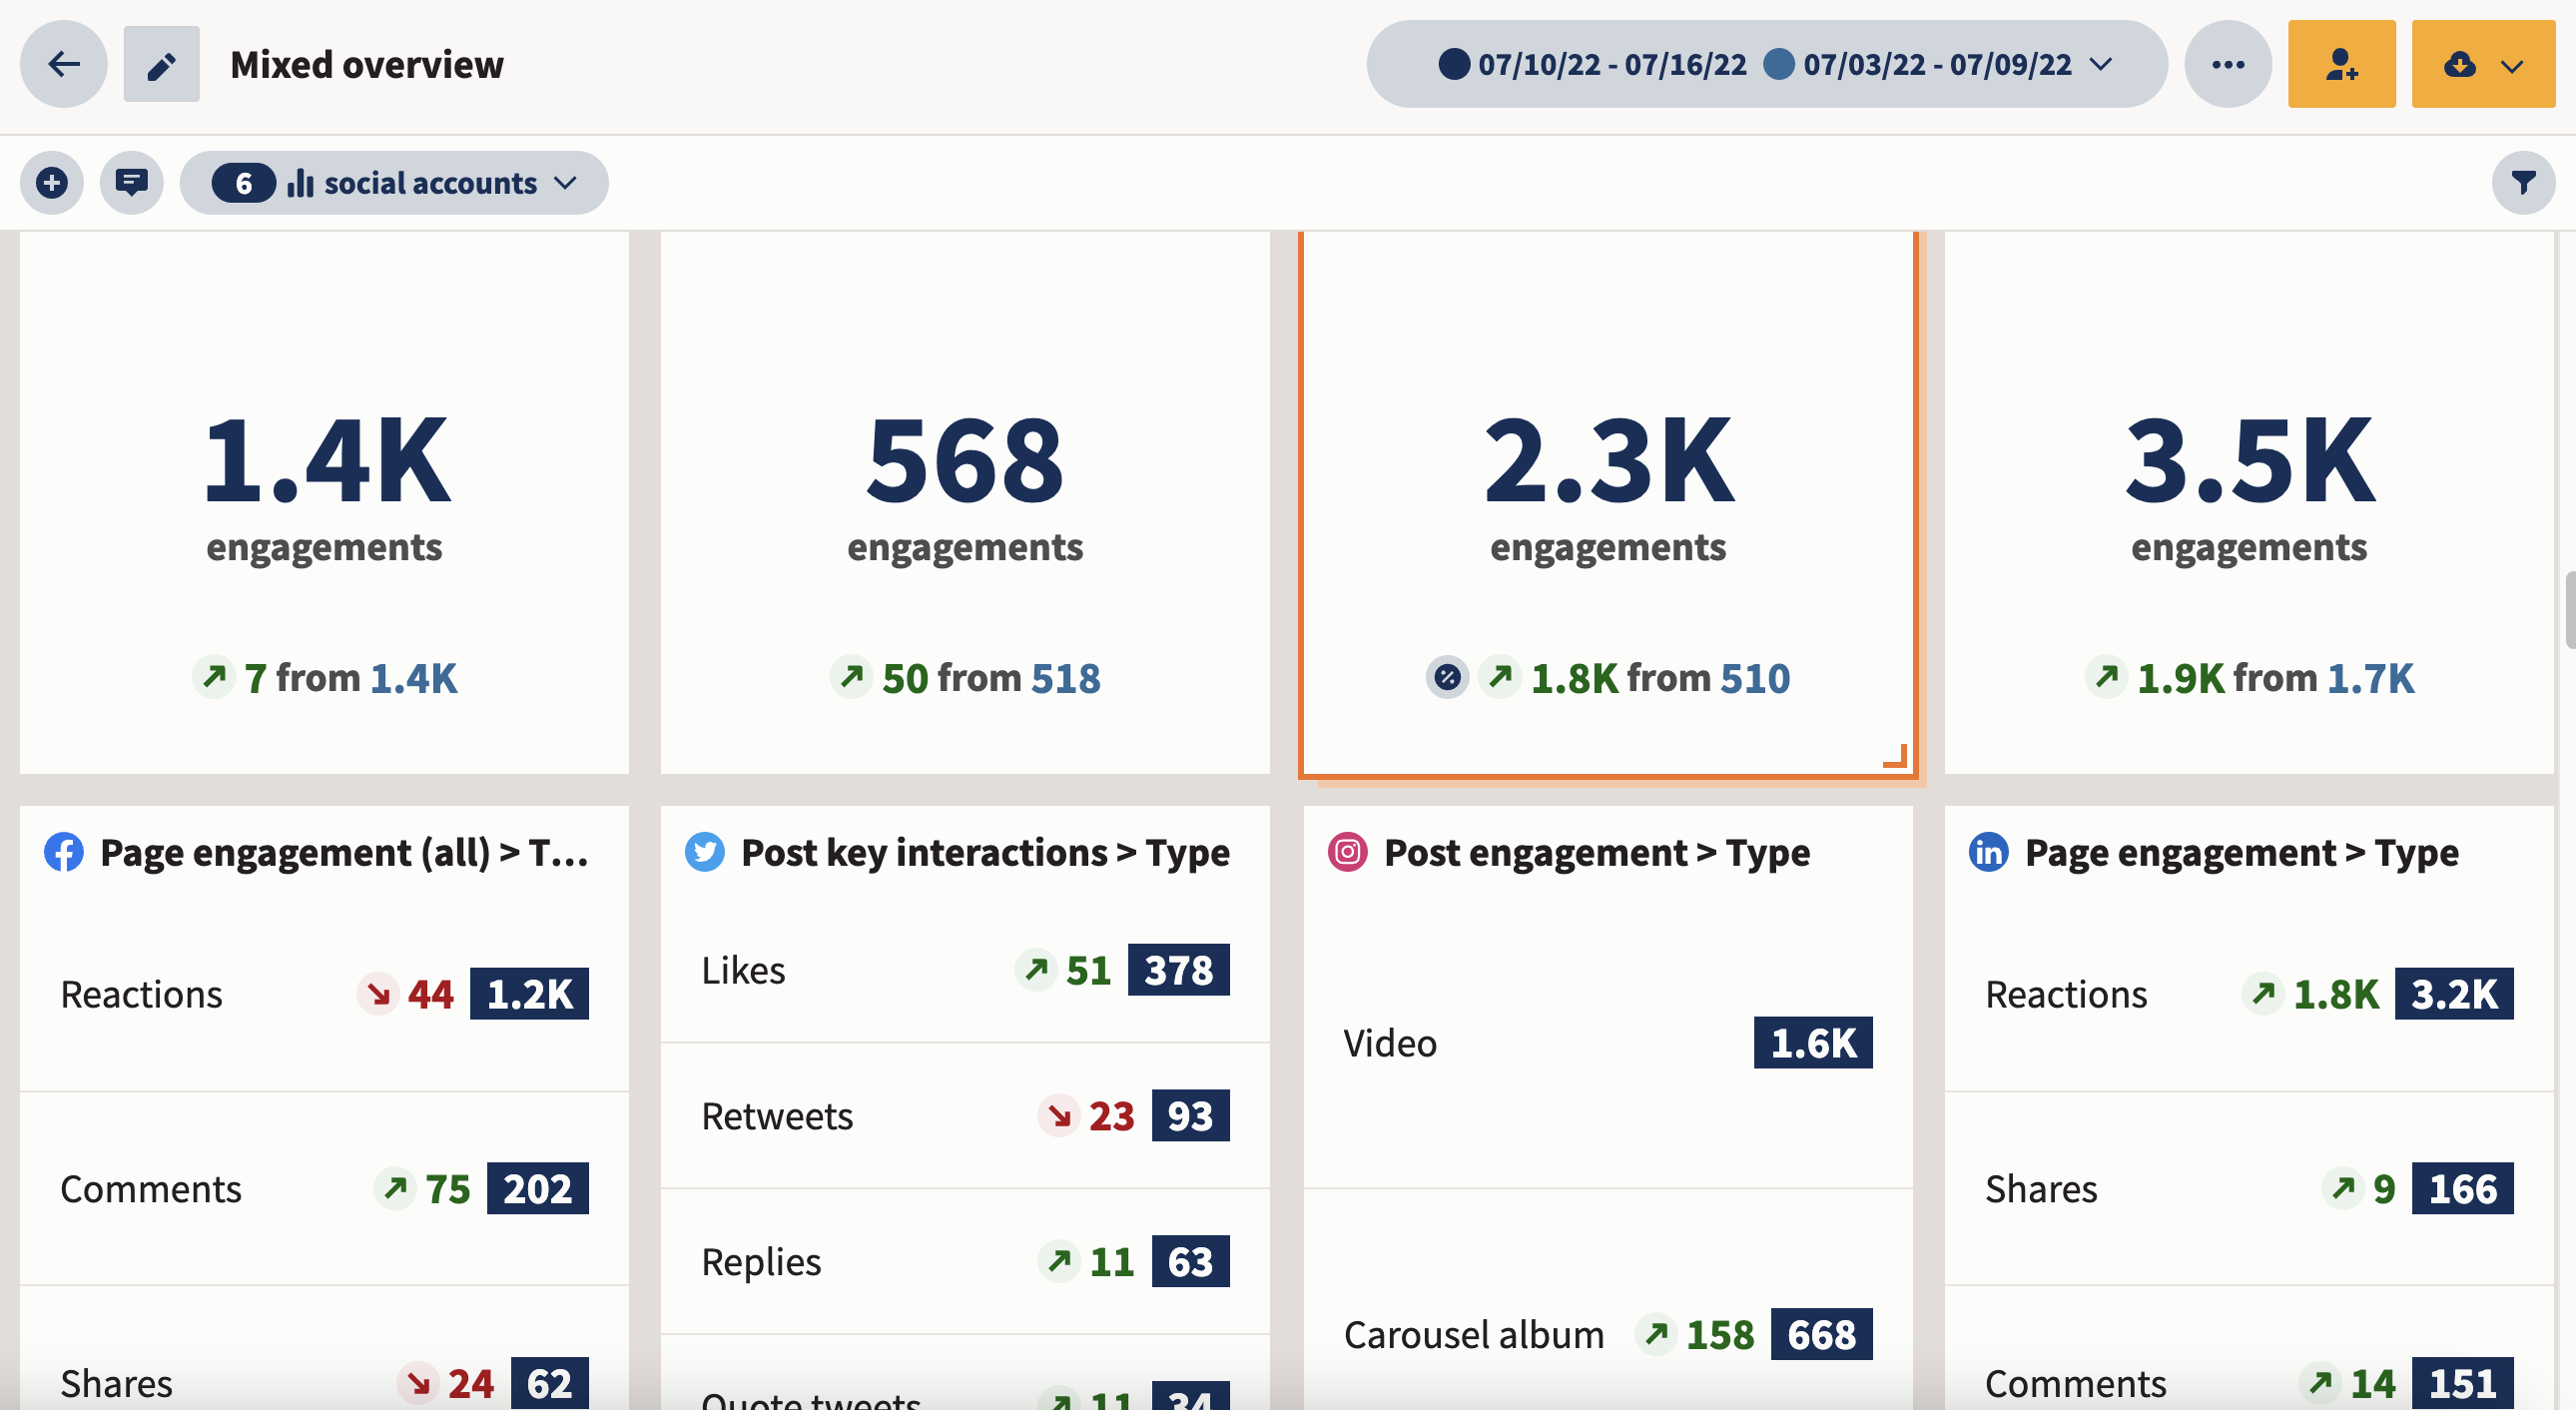
Official Perspective: The Role of Analytics Tools
Modern social media management requires more than just manual calculation. The complexity of tracking multiple platforms, different time zones, and varying content types makes automated analytics essential for any scaling team.
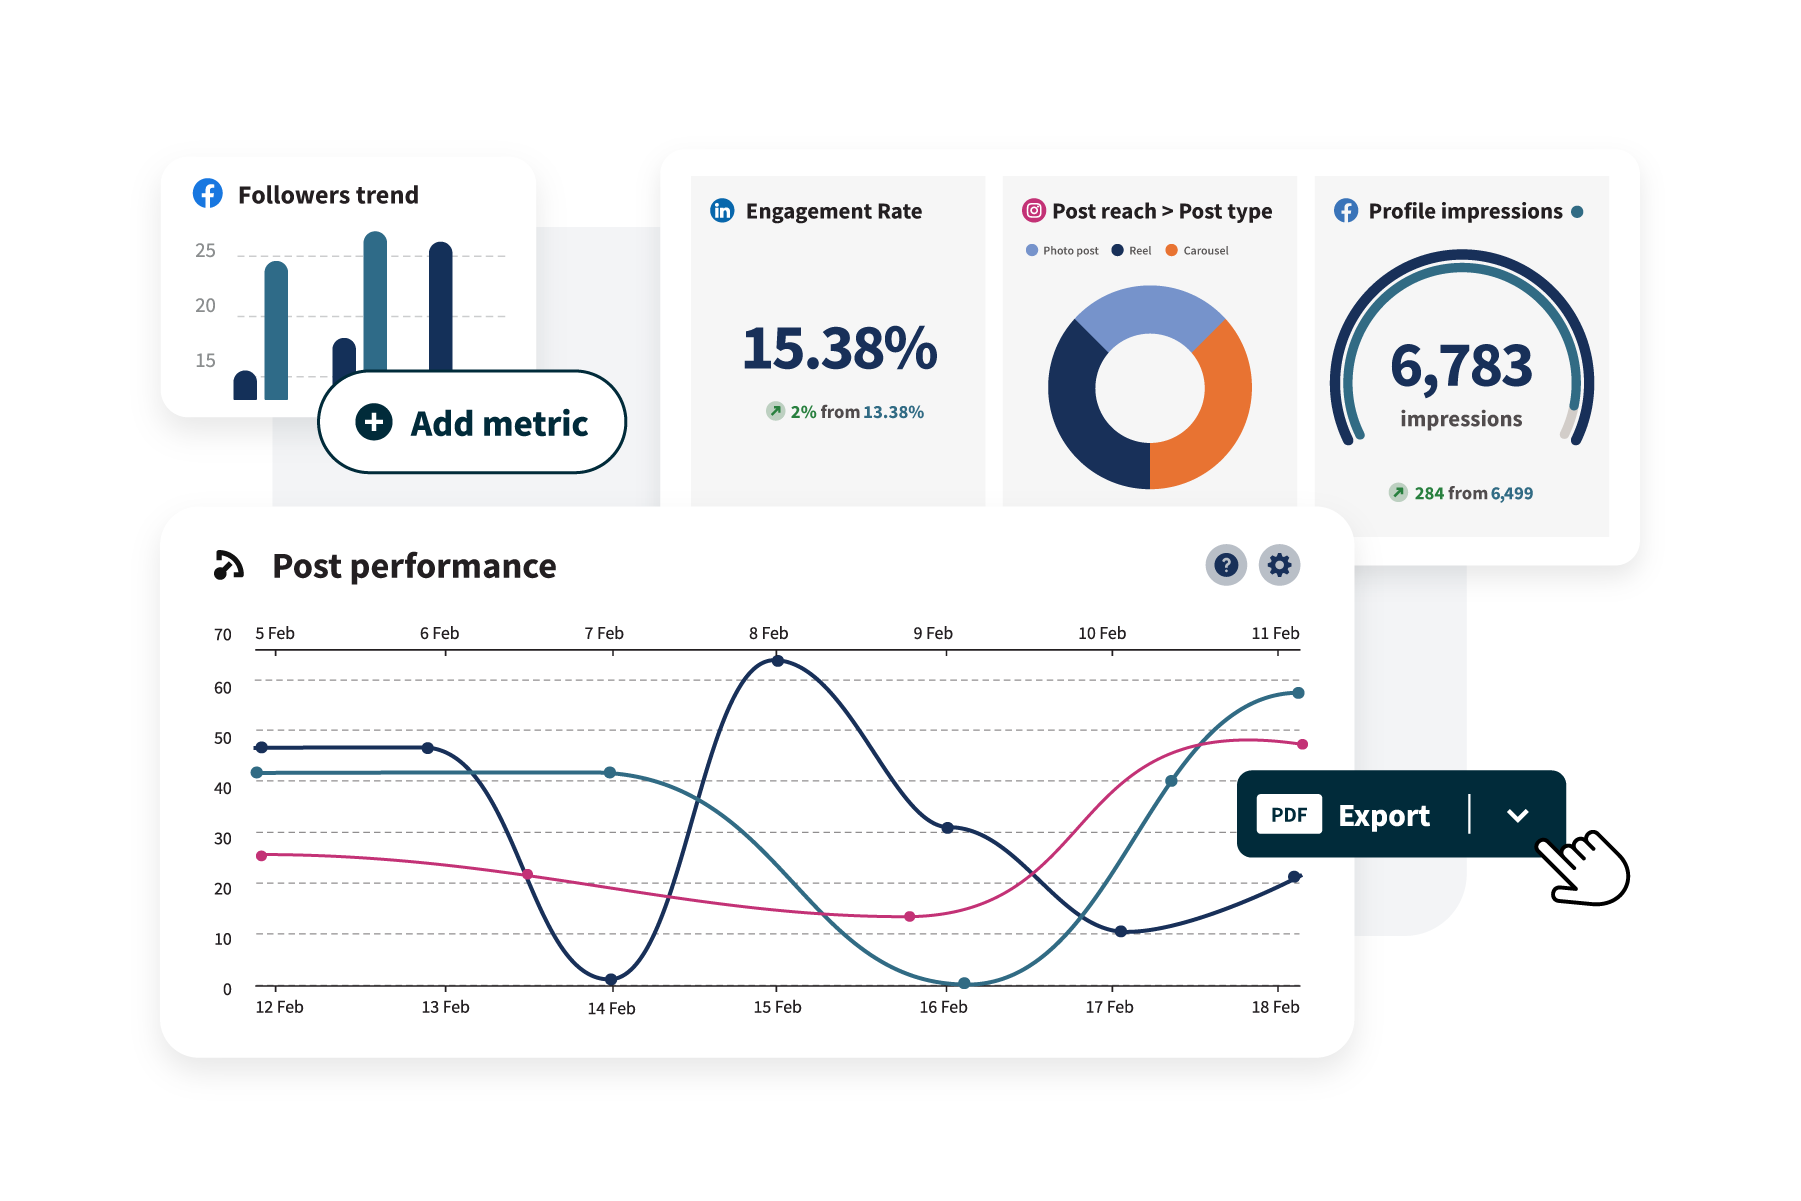
Hootsuite’s analytics dashboard serves as an industry-standard solution for this challenge. By consolidating data from Facebook, LinkedIn, Instagram, X, and TikTok into a single view, brands can:
- Identify high-performing content formats instantly.
- Schedule reports to be sent directly to stakeholders.
- Use "Industry Benchmarking" tools to see how they stack up against direct competitors in real-time.
As one official spokesperson for the platform noted: "The goal isn’t just to track numbers—it’s to extract the ‘why’ behind the numbers so that the next piece of content is more effective than the last."
Implications for Future Strategy
The data suggests a clear path forward for brands looking to maximize their social ROI. The "Post and Pray" method is dead. The future of social media marketing lies in Intentional Engagement.
How to Implement These Findings:
- Prioritize Quality over Frequency: If your engagement rate is low, reduce your posting frequency and increase the depth of your content.
- The "First Hour" Rule: The first hour after posting is critical for algorithmic signals. Respond to every comment immediately to jumpstart the conversation.
- Leverage User-Generated Content (UGC): Data consistently shows that audiences engage more with human-centric content than polished, corporate-style graphics.
- Use Data to Time Your Posts: Use your analytics tool to determine when your specific audience is most active, rather than relying on global "best times to post" guides.
Final Thoughts
Engagement rate is the ultimate barometer of your brand’s digital personality. By moving away from vanity metrics and focusing on the formulas that best represent your specific goals—whether it’s reach, conversion, or long-term community building—you can turn your social media presence from a megaphone into a two-way conversation.
In 2026, the brands that win will be those that listen as much as they speak. By analyzing your engagement data, you are not just looking at a dashboard; you are listening to what your audience wants, needs, and cares about. Let that data guide your strategy, and the growth will follow.
