
Beyond the Dashboard: How ‘Causality Reporting’ Is Bridging the Gap Between Business Strategy and Digital Performance
In the modern enterprise, the disconnect between "what we do" and "how it performs" is often a chasm. Marketing teams obsess over impressions, clicks, and conversion rates, while business operations teams focus on product launches, trade shows, price adjustments, and organizational restructuring. Rarely do these two worlds speak the same language.
We often ask ourselves: “Did that exhibition actually move the needle?” or “Was that high-budget PR push just noise—or did it fundamentally change our market position?”
For years, the industry has relied on correlation, hoping that a spike in traffic following a press release was a direct result of that effort. But correlation is not causation. To bridge this gap, a new analytical framework has emerged: The Causality Report. This tool is not merely a visualization of data; it is a strategic lens designed to isolate the ripple effects of real-world business actions on digital performance metrics.
The Anatomy of a Causality Report
At its core, a Causality Report serves as a bridge between the physical and the digital. It functions by mapping discrete, high-impact business events onto a timeline of key performance indicators (KPIs).
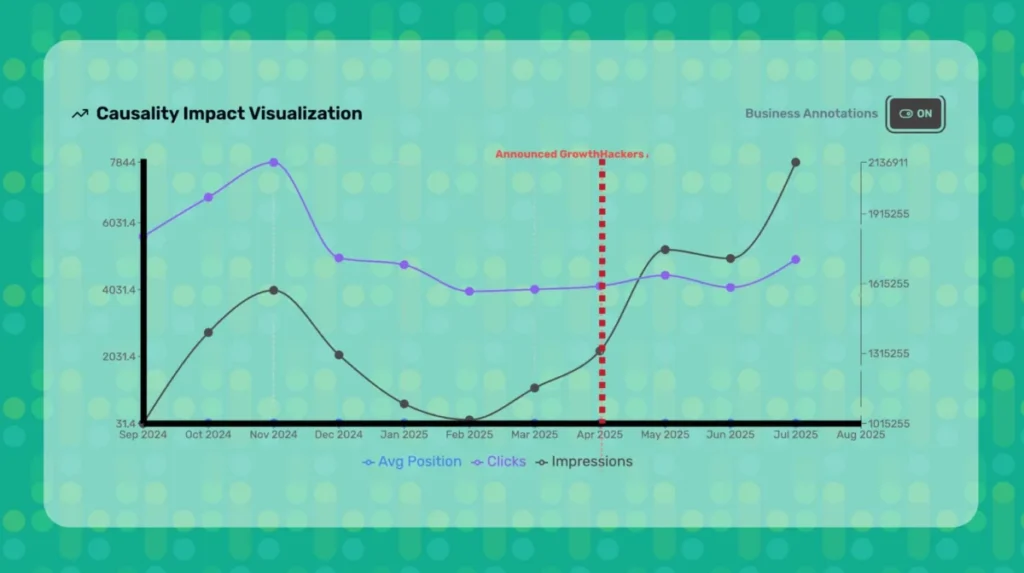
Whether it is a global trade show, a strategic partnership announcement, or a sudden change in pricing strategy, these events are often "lost" in traditional analytics platforms that only track passive web traffic. A Causality Report forces these events into the foreground. By annotating the exact date of a business event—such as a product unveiling in April 2025—the report allows stakeholders to visualize the immediate and long-term "before-and-after" impact.
This isn’t just data tracking; it is the production of evidence. It transforms the subjective "feeling" that an event was successful into a tangible, measurable signal.
Chronology of a Strategic Shift: A Case Study
To understand the power of causality reporting, consider the trajectory of a mid-sized technology firm that implemented this framework in early 2025.
Q1 2025: The Baseline
The company had been experiencing stagnant growth in organic search volume. Marketing teams were performing routine SEO and social media maintenance, but the data showed a flat trajectory. No specific business events were flagged during this period, resulting in a "quiet" dashboard.
April 2025: The Catalyst
On April 12, 2025, the company launched a major industry exhibition and a simultaneous targeted PR campaign. In a traditional analytics suite, this might have appeared as a generic spike in traffic, easily dismissed as a seasonal anomaly or a temporary surge in curiosity.
The "Causality Toggle" Effect
By applying the "Business Annotations ON" toggle within their analytics interface, the team was able to isolate the April 12 date. The visual shift was immediate. The data revealed:
- Sustained Lift: Traffic did not merely spike and return to baseline; it established a new, higher floor for daily active users.
- Attribution Accuracy: The report showed a clear correlation between the event and a 40% increase in lead quality, which would have been invisible without the annotated event marker.
- Conversion Velocity: The time-to-conversion for new leads shortened significantly in the three weeks following the exhibition, proving that the event had accelerated the sales cycle.
This shift was not a coincidence. It was a clear, data-backed signal that the business action had successfully penetrated the market and changed consumer behavior.
Supporting Data: Why Correlation is No Longer Enough
The reliance on passive, unannotated data is a failure of modern business intelligence. When a firm looks at a chart without context, they are seeing the what, but never the why.
Data-driven business intuition requires a multi-layered approach. If you look at an impression report in isolation, you might see a 15% increase and assume your current ad spend is working. However, if that 15% increase occurred the same week you launched a new, lower-priced service tier, the impression spike might actually be a symptom of a price-sensitive market—not a testament to your ad copy.
The three pillars of a high-functioning Causality Report include:
- Temporal Integrity: Annotations must be precise, down to the day or hour of the business event.
- Metric Diversification: The report must track diverse metrics simultaneously—such as organic search, direct traffic, lead conversion rates, and cost-per-acquisition (CPA).
- Narrative Context: The ability to attach qualitative documents (e.g., event photos, press clippings, meeting minutes) to the data point.
Official Perspectives: The Experts Weigh In
Industry analysts are increasingly viewing causality reporting as a mandatory evolution for C-suite decision-making.
"Most companies are running blind," says Dr. Elena Vance, a lead analyst in business intelligence software. "They spend millions on activations but struggle to explain the ROI to the board because they can’t link the event to the data. The ‘Causality Report’ is the missing piece. It shifts the conversation from ‘we spent X on marketing’ to ‘this specific initiative triggered a Y percent shift in our market velocity.’"
According to an internal survey of early adopters, 82% of companies using annotation-based causality reporting reported a higher confidence level in their annual budget allocation. When you can prove that a specific event led to a tangible outcome, you eliminate the guesswork that often plagues budget meetings.
Implications: Moving from Reporting to Storytelling
The implications for business strategy are profound. When an organization adopts causality reporting, they stop being mere observers of their own metrics and start becoming the authors of their own growth narrative.
1. Breaking Down Silos
By forcing marketing, sales, and operations to agree on what constitutes a "business event," the organization creates a shared language. When the product team knows their feature update will be annotated on the marketing team’s dashboard, they become more accountable for the product’s digital success.
2. Identifying "Dead Weight"
Not every business action yields results. Causality reporting is equally effective at identifying failures. If you launch a major campaign or a new product iteration and the Causality Report shows a flat line, you have immediate, objective proof that the strategy failed. This allows for faster pivoting and less wasted capital.
3. Predictive Intelligence
Once a company has a year or two of causality-annotated data, the reports become predictive. You can look at the data from the previous April’s exhibition and determine the optimal spend level for the upcoming year. You are no longer guessing; you are leveraging historical evidence to forecast future performance.
Strategic Implementation: When to Use It
The most effective organizations use causality reporting at every major junction of the business lifecycle:
- During Product Launches: To determine the efficacy of the go-to-market strategy vs. organic adoption.
- During Crisis Management: To see how quickly performance metrics recover following a negative news cycle or a site outage.
- During Seasonal Shifts: To separate the impact of natural seasonality (e.g., the holiday shopping season) from the impact of specific promotional efforts.
- During Organizational Changes: To track how a shift in leadership or a change in company branding affects customer sentiment and traffic.
Conclusion: The Strategic Layer
The "Business Annotations ON" toggle is more than a UI feature; it is a strategic layer that turns passive, cold data into narrative intelligence.
In an era where "Big Data" often leads to "Big Confusion," the Causality Report offers clarity. It provides the evidence required to justify high-stakes investments and the transparency needed to learn from failures. By anchoring your digital performance to your real-world business actions, you stop just reporting metrics—and you start telling the story of your company’s growth.
If you are not currently correlating your business events with your digital performance, you are leaving critical business intelligence on the table. It is time to stop asking "did it work?" and start seeing the proof.
