

Optimizing Digital Gateways: The Essential Metrics for Landing Page Performance
Last Modified on March 19, 2025
In the bustling metropolis of the internet, websites serve as digital storefronts, inviting visitors to explore offerings. Within this landscape, landing pages function as the meticulously curated window displays – the critical first impression designed to capture immediate attention and compel entry. Just as a physical shop window’s allure dictates whether a passerby steps inside or continues on, a landing page profoundly influences whether a digital visitor engages with a brand or swiftly "bounces" away. This initial encounter is paramount; it determines not only the user’s immediate action but often the longevity of their relationship with the brand.
The strategic importance of landing pages is further underscored by the substantial investments digital marketers channel into driving traffic to them. Through sophisticated ad campaigns across various platforms, meticulous search engine optimization (SEO) efforts, and targeted email marketing, significant resources are expended to bring potential customers to these specific digital destinations. Consequently, understanding user behavior on these pages and accurately measuring their performance is not merely beneficial—it is an imperative for maximizing return on investment and achieving marketing objectives.

This comprehensive guide delves into the top 10 landing page metrics that every digital marketer and business owner must track. Regardless of the specific analytics tool employed, these metrics provide invaluable insights into user engagement, conversion efficiency, and overall campaign effectiveness, laying the groundwork for continuous optimization.
The Foundation: Understanding the Digital Shop Window
Landing pages are purpose-built web pages designed with a single objective: to elicit a specific action from the visitor, known as a conversion. This could range from signing up for a newsletter, downloading an ebook, registering for a webinar, or making a purchase. Their effectiveness directly impacts marketing campaign success and, ultimately, business growth. By meticulously analyzing key performance indicators (KPIs), organizations can transform raw data into actionable strategies, refining their digital presence and enhancing the user journey.
Let’s explore the critical metrics that illuminate the path to landing page mastery.
1. Traffic Sources: The Origin Story of Your Visitors
While not a metric in itself, understanding your traffic sources is the foundational context for all subsequent metrics. It reveals where your visitors are coming from, providing crucial insights into the effectiveness of your marketing channels.
- Definition: Traffic sources categorize how users arrive at your landing page (e.g., Organic Search, Paid Search, Social Media, Direct, Referral, Email).
- Importance: Segmenting performance by source allows marketers to identify which channels are most effective in driving engaged, converting traffic. It helps in allocating budget and effort efficiently.
- Actionable Insight: If "Paid Search" campaigns are incurring significant costs but exhibiting low conversion rates compared to "Paid Social," this insight empowers a strategic reallocation of budget and resources. Conversely, underperforming channels signal areas for optimization in campaign structure, ad copy, or targeting.
- Tool Integration (GA4): Google Analytics 4 provides robust reporting on traffic acquisition, allowing for detailed analysis of user engagement and conversion rates per source. By applying traffic source as a dimension in your reports, you can drill down into how each channel contributes to other metrics.
2. Conversion Rate: The Ultimate Goal Achieved
The conversion rate is arguably the most critical metric for any landing page, directly measuring its effectiveness in achieving its primary objective.
- Definition: Conversion Rate (CR) is the percentage of visitors who complete a desired action (conversion) on your landing page.
- Calculation:
(Total Conversions / Total Visitors) * 100- Conversions can be micro (e.g., watching a video, clicking a specific link) or macro (e.g., form submission, purchase completion).
- Importance: A high conversion rate indicates that your landing page content, design, and call-to-action (CTA) resonate effectively with your audience. It directly impacts ROI, especially for paid campaigns.
- Interpretation & Optimization: Analyzing conversion rates across different landing pages, traffic sources, or device types can highlight successful strategies and areas needing improvement. For instance, a low conversion rate might suggest issues with the value proposition, page clarity, or technical functionality. Benchmarking against industry averages (which can range from 2% to 10% or higher depending on industry, product, and traffic source) is useful, but nuanced; your specific business model and audience factors heavily influence this figure.
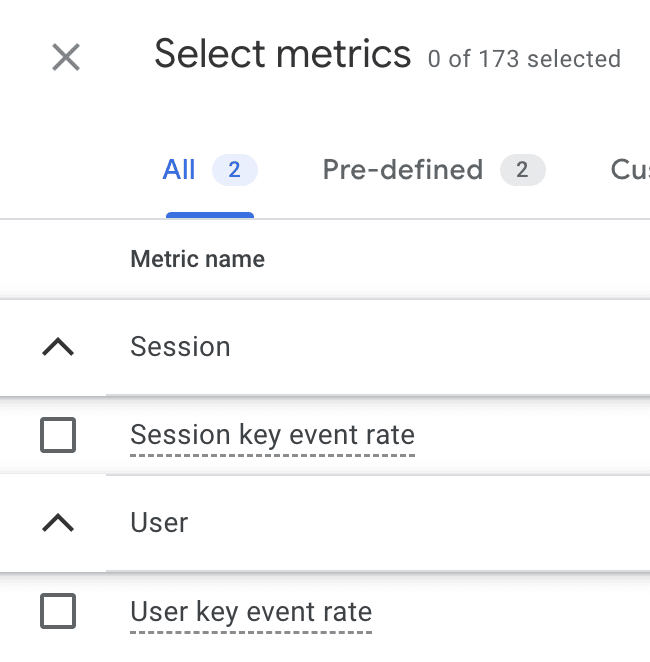
- Tool Integration (GA4): GA4 tracks "Key Events" (formerly goals) and provides "Session conversion rate" and "User conversion rate," offering flexible ways to measure success. Deeper analysis can involve segmenting conversion rates for new versus returning visitors, revealing differences in user intent and engagement.
3. Bounce Rate: The Sign of Disengagement
Bounce rate provides a quick snapshot of initial user engagement, indicating the percentage of visitors who leave your landing page after viewing only one page in a session.
- Definition: Bounce Rate is the percentage of single-page sessions on your site. A "bounce" occurs when a user lands on a page and exits without interacting further.
- Calculation:
(Sessions with one page / Total Sessions) * 100 - Importance: A high bounce rate often signals that the landing page failed to meet user expectations, was irrelevant to the ad/link clicked, or presented a poor user experience.
- Interpretation & Optimization: While a low bounce rate is generally desirable, context is crucial. For instance, a blog post designed to provide quick information might naturally have a higher bounce rate than a product page. However, for a conversion-focused landing page, a high bounce rate (e.g., above 70%) is a red flag. It prompts questions:
- Is the content relevant to the traffic source?
- Is the page loading slowly?
- Is the design confusing or unappealing?
- Is the call-to-action clear and compelling?
- Are there technical issues preventing interaction?
- Industry averages, such as HubSpot’s range of 26% to 70%, serve as a general guide, but specific factors like industry, business model (B2B vs. B2C), and device type cause significant variations. Unusually low bounce rates (e.g., below 20%) can sometimes indicate tracking implementation issues.
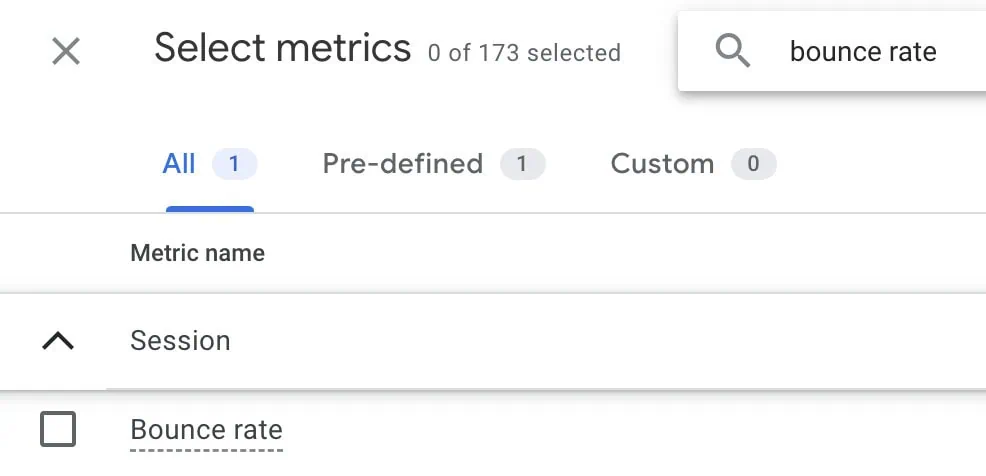
- Tool Integration (GA4): While Universal Analytics explicitly featured Bounce Rate, GA4 focuses on "Engagement Rate" (the inverse of bounce rate) or "Engaged Sessions." However, bounce rate can still be calculated or viewed in GA4’s Explorations by leveraging the "Bounces" metric.
4. Average Time on Page: Gauging Content Resonance
This metric offers insight into how long visitors are actively spending on your landing page, reflecting their interest and engagement with your content.
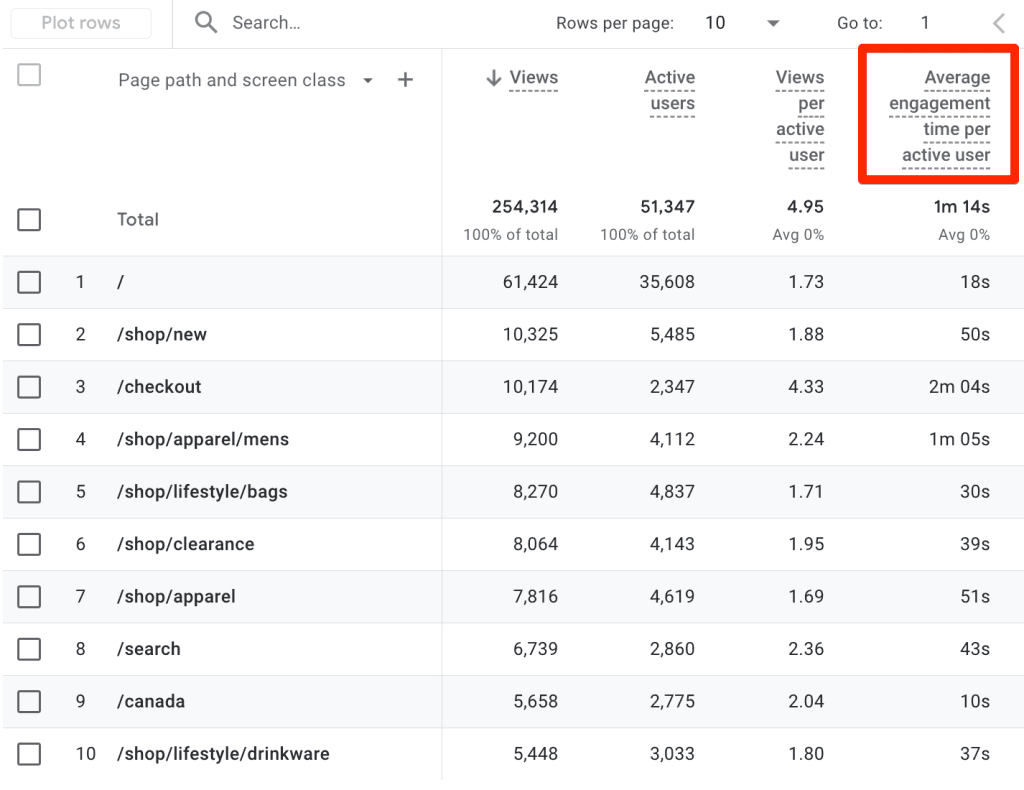
- Definition: Average Time on Page (or Average Engagement Time in GA4) measures the average duration a user spends on a specific landing page during an active session.
- Importance: It helps assess content quality and relevance. Longer times generally suggest deeper engagement, especially for content-rich pages.
- Interpretation & Optimization: The "ideal" time on page is highly contextual.
- For complex products, long-form educational content, or high-value services, a longer average time indicates users are thoroughly consuming the information. A short time here might mean the content is not compelling or is difficult to digest.
- For simple, conversion-focused pages with minimal text and a clear form, a shorter time might be acceptable, provided conversions are high. Conversely, an unusually long time on such a page could signal user confusion or technical issues with forms/CTAs.
- Tool Integration (GA4): GA4 provides "Average Engagement Time" within its "Pages and screens" report, which is a more accurate measure than traditional "time on page" as it excludes inactive time. This metric is crucial for understanding how well your content holds attention.
5. Form Abandonment Rate: Uncovering Conversion Roadblocks
Specific to landing pages featuring forms (e.g., lead generation, contact forms), this metric highlights friction points in the conversion process.
- Definition: Form Abandonment Rate measures the percentage of users who start filling out a form but do not complete it.
- Calculation:
((Forms Started - Forms Completed) / Forms Started) * 100- Example:
(600 users started - 240 completed) / 600 * 100 = 60% abandonment rate. - Alternatively:
1 - (Form Completion Rate), whereForm Completion Rate = (Forms Completed / Forms Started) * 100.
- Example:
- Importance: A high abandonment rate indicates significant barriers to completion, directly impacting lead generation and sales.
- Interpretation & Optimization: This metric helps diagnose issues such as:
- Form Length: Too many fields can overwhelm users.
- Complexity: Confusing questions or unclear instructions.
- Privacy Concerns: Asking for too much sensitive information too soon.
- Technical Glitches: Form validation errors, slow submission.
- Lack of Trust: Missing security badges or privacy policy links.
- Optimizing forms by reducing fields, using clear labels, offering progress bars for multi-step forms, and ensuring mobile responsiveness can significantly lower abandonment rates.
- Tool Integration (GA4): While GA4 doesn’t have a built-in "form abandonment rate," it can be tracked by setting up custom events for "form_start" and "form_submit" and then creating a calculated metric or report in Explorations or Looker Studio. Many dedicated form analytics tools also offer this metric out-of-the-box.
6. Cost Per Conversion (CPC): Financial Efficiency of Acquisition
For landing pages driven by paid marketing efforts, Cost Per Conversion (or Cost Per Acquisition, CPA) is a vital financial metric.
- Definition: Cost Per Conversion measures the average cost incurred to achieve one conversion on your landing page.
- Calculation:
(Total Marketing Cost / Total Conversions)- Example:
$2,500 marketing spend / 121 conversions = $20.67 CPC.
- Example:
- Importance: This metric directly ties marketing spend to business outcomes, determining the profitability and efficiency of your campaigns.
- Interpretation & Optimization: Ideally, your CPC should be significantly lower than the value of the conversion (e.g., the revenue generated by a sale, or the estimated lifetime value of a lead). A high CPC might necessitate:
- Landing Page Optimization: Improving conversion rate to get more conversions for the same cost.
- Ad Campaign Optimization: Refining targeting, ad copy, and bidding strategies to lower acquisition costs.
- Channel Evaluation: Identifying more cost-effective traffic sources.
- It’s crucial to compare CPC across different campaigns, keywords, and traffic sources to identify opportunities for financial optimization.
- Tool Integration: This metric is typically calculated by integrating data from your advertising platforms (Google Ads, Meta Ads, etc.) with your analytics data (GA4) in a dashboard tool like Looker Studio or through manual calculation.
7. Exit Rate: Identifying Drop-Off Points in User Journeys
Often confused with bounce rate, exit rate focuses on a specific page within a multi-page session, indicating where users decide to leave your website entirely.
- Definition: Exit Rate is the percentage of pageviews for a specific page that were the last in a session. It measures how often users leave your site from that particular page, regardless of how many pages they viewed prior.
- Calculation:
(Number of Exits from Page / Total Pageviews for Page) * 100 - Importance: While a bounce is always an exit, an exit isn’t always a bounce. Exit rate helps identify pages where users frequently end their journey, even if they’ve interacted with other pages before.
- Interpretation & Optimization:
- For a landing page intended to be the final step in a conversion funnel (e.g., a "thank you" page after a purchase), a high exit rate is expected and even desirable.
- However, if a landing page is designed to guide users to subsequent pages (e.g., product details, further content), a high exit rate suggests a breakdown in the user flow.
- Analyze the content, CTAs, and overall experience of high exit rate pages that are not intended as end points. Are users finding what they need? Are there clear next steps? Are there distractions leading them away? This often requires a holistic view of the user’s entire journey on the site.
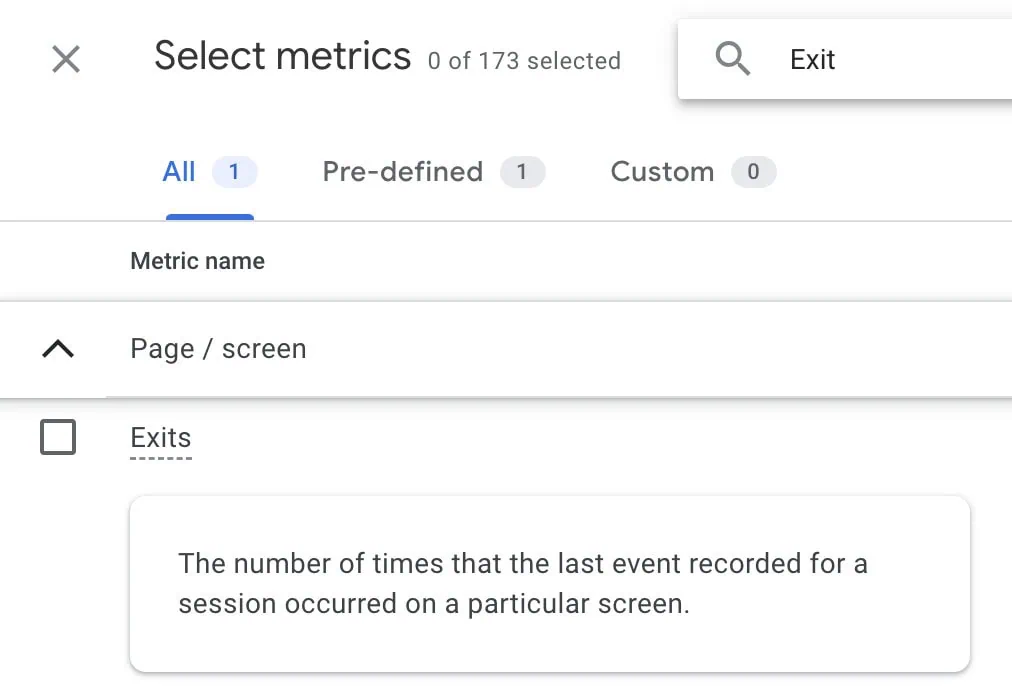
- Tool Integration (GA4): GA4 provides "Exits" as a metric. To calculate the exit rate, you would typically export the data and perform the calculation in a spreadsheet or a data visualization tool like Looker Studio, combining "Exits" with "Page views."
8. Scroll Depth: Unveiling Content Consumption
Scroll depth is an engagement metric that reveals how far down a landing page visitors are scrolling, offering insights into content visibility and consumption.
- Definition: Scroll depth measures the percentage of a page that a user has viewed by scrolling vertically. It’s commonly tracked at thresholds like 10%, 25%, 50%, 75%, and 100%.
- Importance: This metric is crucial for long-form landing pages or pages with important information (CTAs, social proof, security badges) placed lower down. It helps ensure critical elements are seen.
- Interpretation & Optimization:
- If key messages or primary CTAs are consistently below the average scroll depth, it indicates they are being missed. This might require redesigning the layout, shortening content, or repositioning elements.
- Low scroll depth on a content-heavy page suggests users are not finding the content compelling enough to continue reading.
- While primarily vertical, consider horizontal scrolling for elements like comparison tables; if users aren’t seeing the full breadth of content, it’s a design issue.
- Tool Integration (GA4): GA4 automatically tracks scroll depth as an "enhanced measurement" event (specifically,
scroll). You can analyzepercent_scrolledas a dimension in Explorations to understand content engagement patterns. Complementary tools like Hotjar or Clarity provide visual heatmaps and scroll maps for even deeper qualitative insights.
9. Click-Through Rate (CTR): Measuring Interaction Effectiveness
CTR on a landing page measures the effectiveness of interactive elements like buttons, links, and banners in prompting users to take the next step.
- Definition: Click-Through Rate (CTR) is the percentage of visitors who click on a specific interactive element (e.g., a button, a hyperlink) on your landing page.
- Calculation:
(Total Clicks on Element / Total Impressions of Element) * 100- Impressions refer to the number of times an element was visible to users.
- Example:
107 clicks / 2,340 impressions = 4.55% CTR.
- Importance: A high CTR indicates that your copy, design, and calls-to-action are compelling and relevant, successfully guiding users to their next intended action (e.g., another page, a modal window).
- Interpretation & Optimization:
- Low CTR suggests that the element itself (text, design, placement) is not attractive or persuasive, or the preceding content hasn’t built enough desire for the click.
- A sudden drop in CTR could also flag technical issues like broken links or unresponsive buttons.
- Optimizing CTR involves A/B testing different CTA texts, button colors, placements, and surrounding copy to find the most effective combinations.
- Tool Integration (GA4): CTR for on-page elements typically requires custom event tracking for clicks on specific elements. GA4’s event-based model is well-suited for this, allowing you to track clicks on buttons, links, and other interactive components, and then calculate CTR by comparing click events to pageview events (as a proxy for impressions if direct impression tracking isn’t set up).
10. New vs. Returning Visitors: Tailoring User Experiences
Understanding the behavior of new versus returning visitors provides critical context for personalizing experiences and refining marketing strategies.
- Definition: This metric differentiates between users visiting your landing page for the first time ("New Visitors") and those who have visited before ("Returning Visitors").
- Importance: New visitors often require more introductory information, trust-building elements, and a clearer value proposition. Returning visitors, having some prior brand awareness, might be looking for more detailed information, specific product features, or to complete a previously initiated action.
- Interpretation & Optimization:
- High Bounce Rate for New Visitors: Could indicate that initial messaging isn’t clear, the page isn’t relevant to their initial search/ad, or they’re overwhelmed. This signals a need for clearer headlines, stronger hero sections, and more immediate value propositions.
- Lower Conversion Rate for New Visitors on High-Value Items: Suggests a longer sales cycle, requiring more nurturing and information before conversion.
- Higher Engagement for Returning Visitors: Implies they are deeper in the funnel or found value in their previous visit. Leverage this with personalized content or direct pathways to conversion.
- Analyzing these segments in conjunction with other metrics (e.g., "New Visitor Conversion Rate" vs. "Returning Visitor Conversion Rate") reveals distinct behavioral patterns and opportunities for targeted optimization.
- Tool Integration (GA4): GA4 readily provides data on "New users" and "Returning users" as standard dimensions and metrics. You can apply these segments in various reports and Explorations to compare their behavior across all other metrics. Qualitative analysis using session recordings or heatmaps for each segment can further illuminate their "whys."
Summary and the Path Forward
The performance of your landing pages is a direct reflection of your digital marketing efficacy and ultimately, your business’s ability to attract and convert customers. The ten metrics discussed herein — from the foundational understanding of Traffic Sources to the nuanced insights of New vs. Returning Visitors — provide a robust framework for assessing and optimizing these crucial digital assets.
It is vital to remember that these metrics are rarely viewed in isolation. Their true power emerges when analyzed in combination, providing a holistic view of the user journey. For instance, a high bounce rate paired with a low average time on page and low conversion rate for new visitors from a specific paid campaign paints a clear picture of misalignment between ad and landing page, or a poor initial user experience.
Beyond quantitative data, enriching your analysis with qualitative insights is paramount. Integrating behavioral analytics tools like Hotjar or Microsoft Clarity allows you to visualize user interactions through heatmaps, scroll maps, and session recordings, revealing the "why" behind the "what" in your numbers. Further depth can be achieved through user testing, custom interviews, and exit-intent surveys, uncovering pain points directly from your audience.
Ultimately, the goal of tracking these metrics is not merely to report numbers, but to drive continuous improvement. By fostering a culture of data-driven decision-making, regularly reviewing performance against established benchmarks, and iteratively optimizing your landing pages, you can significantly enhance user experience, boost conversion rates, and maximize the return on your marketing investments.
What metrics do you find most impactful for your landing pages, and how do they inform your optimization strategies? Share your insights in the comments below!
