
The Science of Sales: A Comprehensive Guide to Ecommerce Conversion Rate Optimization (CRO)
In the hyper-competitive digital marketplace, attracting traffic to an online store is only half the battle. The true measure of an ecommerce business’s health lies in its ability to convert those visitors into paying customers. This process—known as Conversion Rate Optimization (CRO)—is the systematic art and science of identifying why potential buyers abandon their carts and implementing strategic fixes to remove friction.
As modern consumers become increasingly discerning, the difference between a thriving store and one struggling to break even often comes down to the efficiency of the conversion funnel.
Main Facts: Defining the CRO Landscape
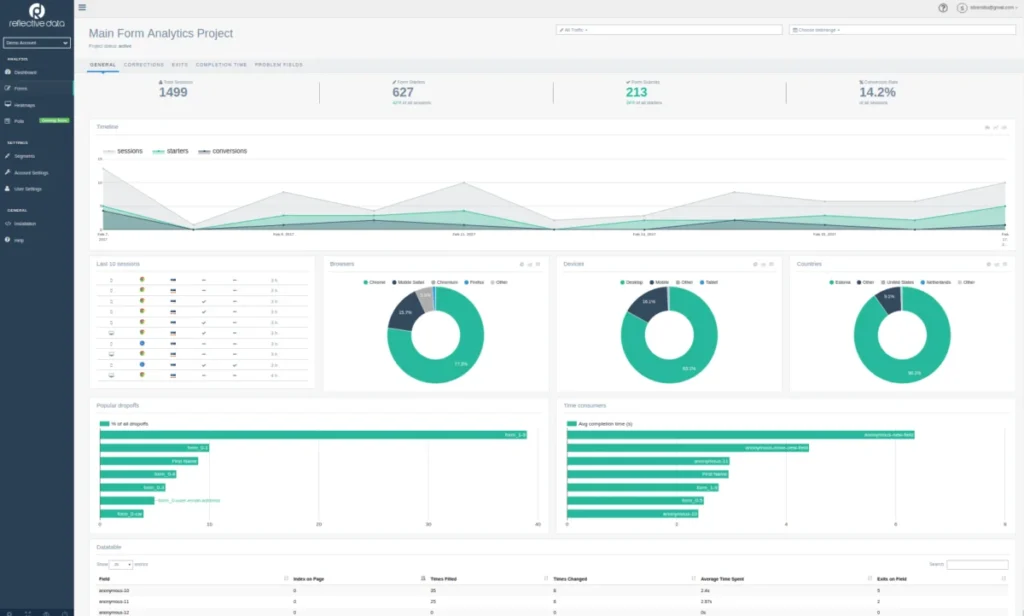
At its core, ecommerce CRO is a data-driven discipline. It involves using behavioral analytics to pinpoint "leaks" in the shopping journey. Whether it is a slow-loading product page, a confusing checkout form, or a lack of trust signals, these micro-frictions accumulate to create significant revenue loss.
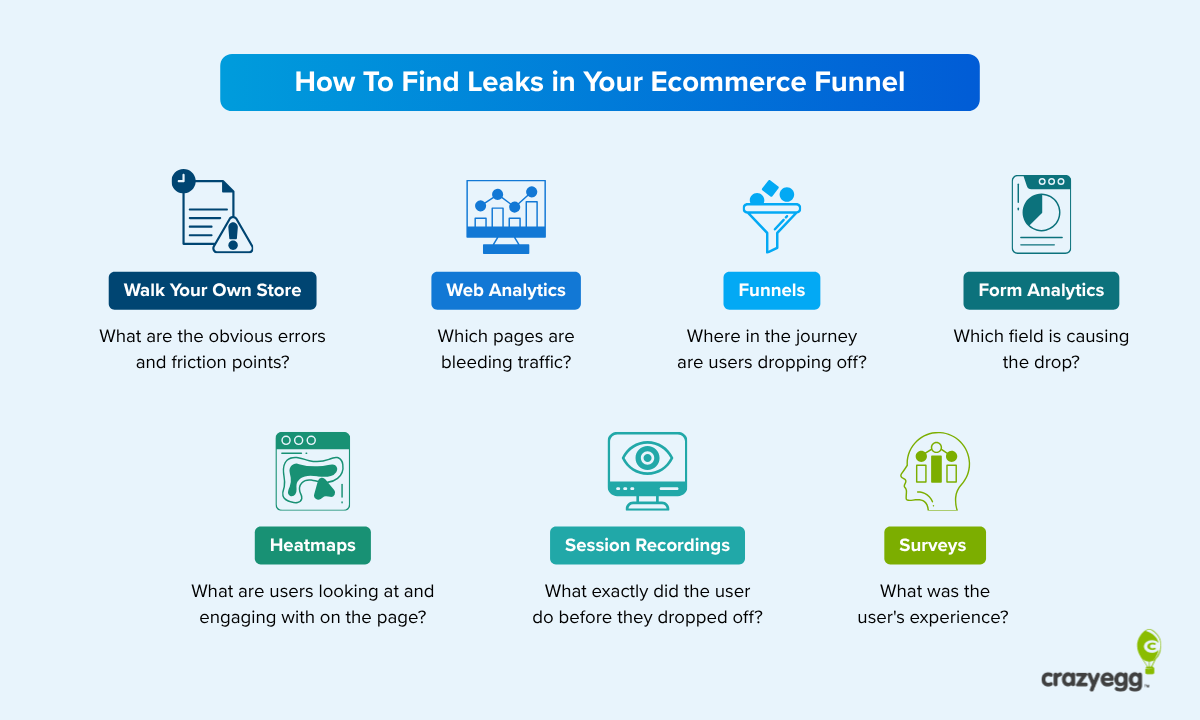
Specialists rely on a robust tech stack to diagnose these issues. This includes:
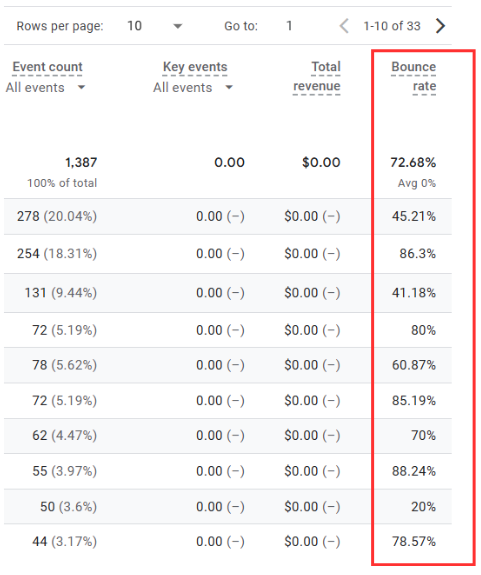
- Web Analytics: To track bounce and exit rates.
- Funnel Analysis: To visualize where users drop off during the path to purchase.
- Behavioral Tools: Heatmaps and session recordings that provide a "fly-on-the-wall" perspective of the user experience.
- Direct Feedback: Surveys that capture the "why" behind the "what."
The Chronology of a Conversion Audit
Optimizing a store is not a one-time project; it is a recurring lifecycle. To effectively plug leaks, businesses must follow a structured approach.
1. The Manual "Store Walk"
Before relying on automated data, developers and marketers should physically walk through their own store as if they were a first-time customer. This "sanity check" often reveals glaring issues—broken payment links, non-functional search bars, or confusing navigation—that automated tools might overlook.
2. Identifying Traffic Bleed
The next step involves high-level analytics. By reviewing bounce rates (visitors leaving immediately) and exit rates (visitors leaving from specific pages like the cart), businesses can identify which pages are failing to provide value or instill confidence.
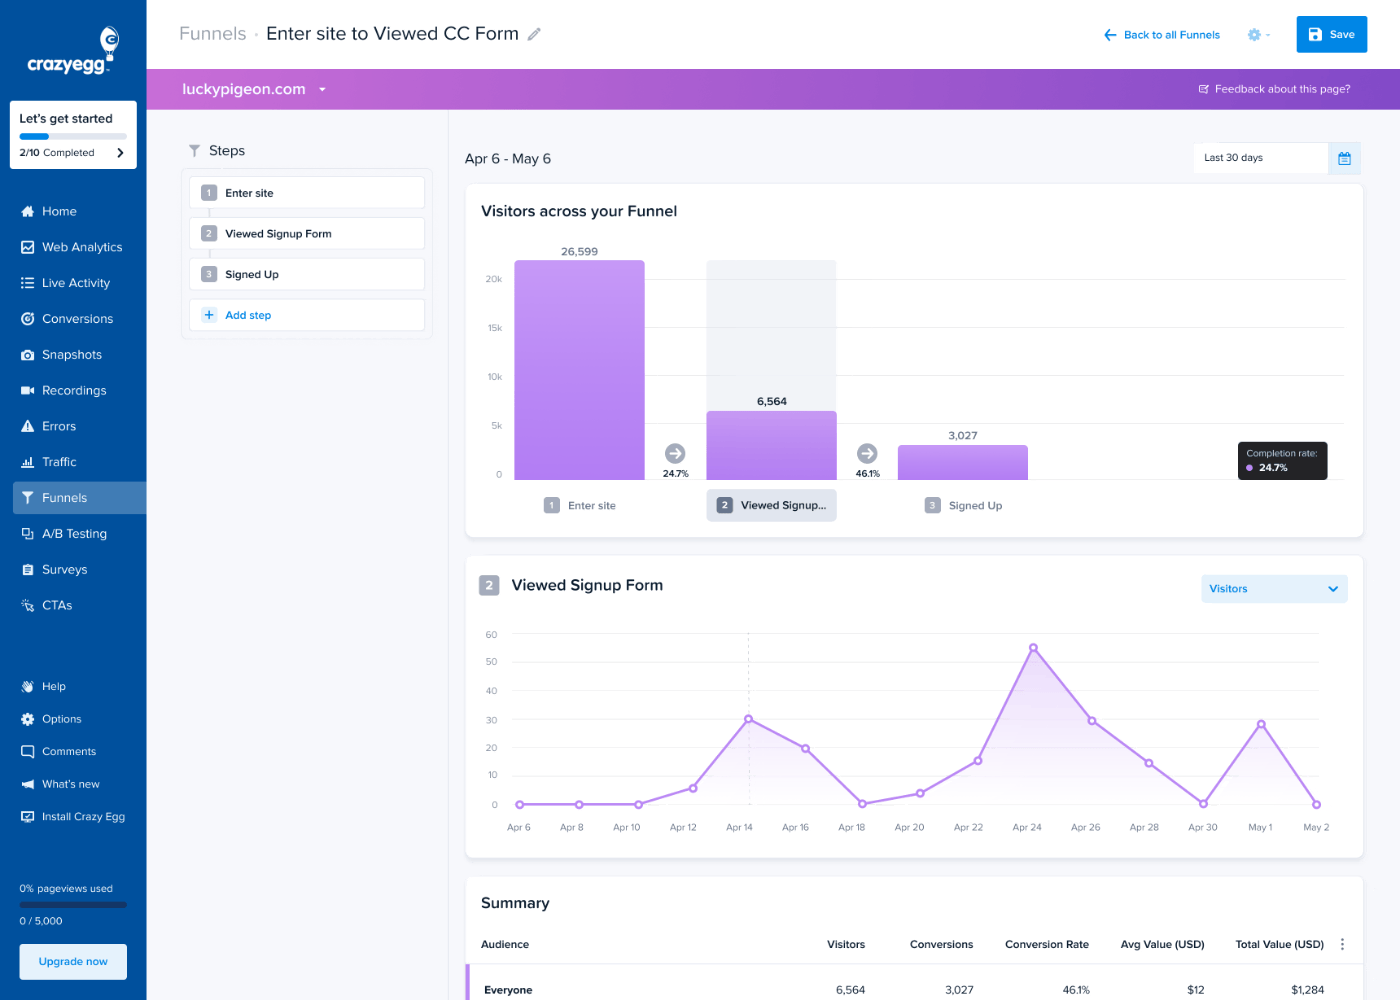
3. Funnel Visualization
Once problematic pages are identified, conversion funnels allow teams to see the exact drop-off points. If 70% of users drop off between "Add to Cart" and "Checkout," the issue is likely rooted in shipping costs, mandatory account creation, or payment security concerns.
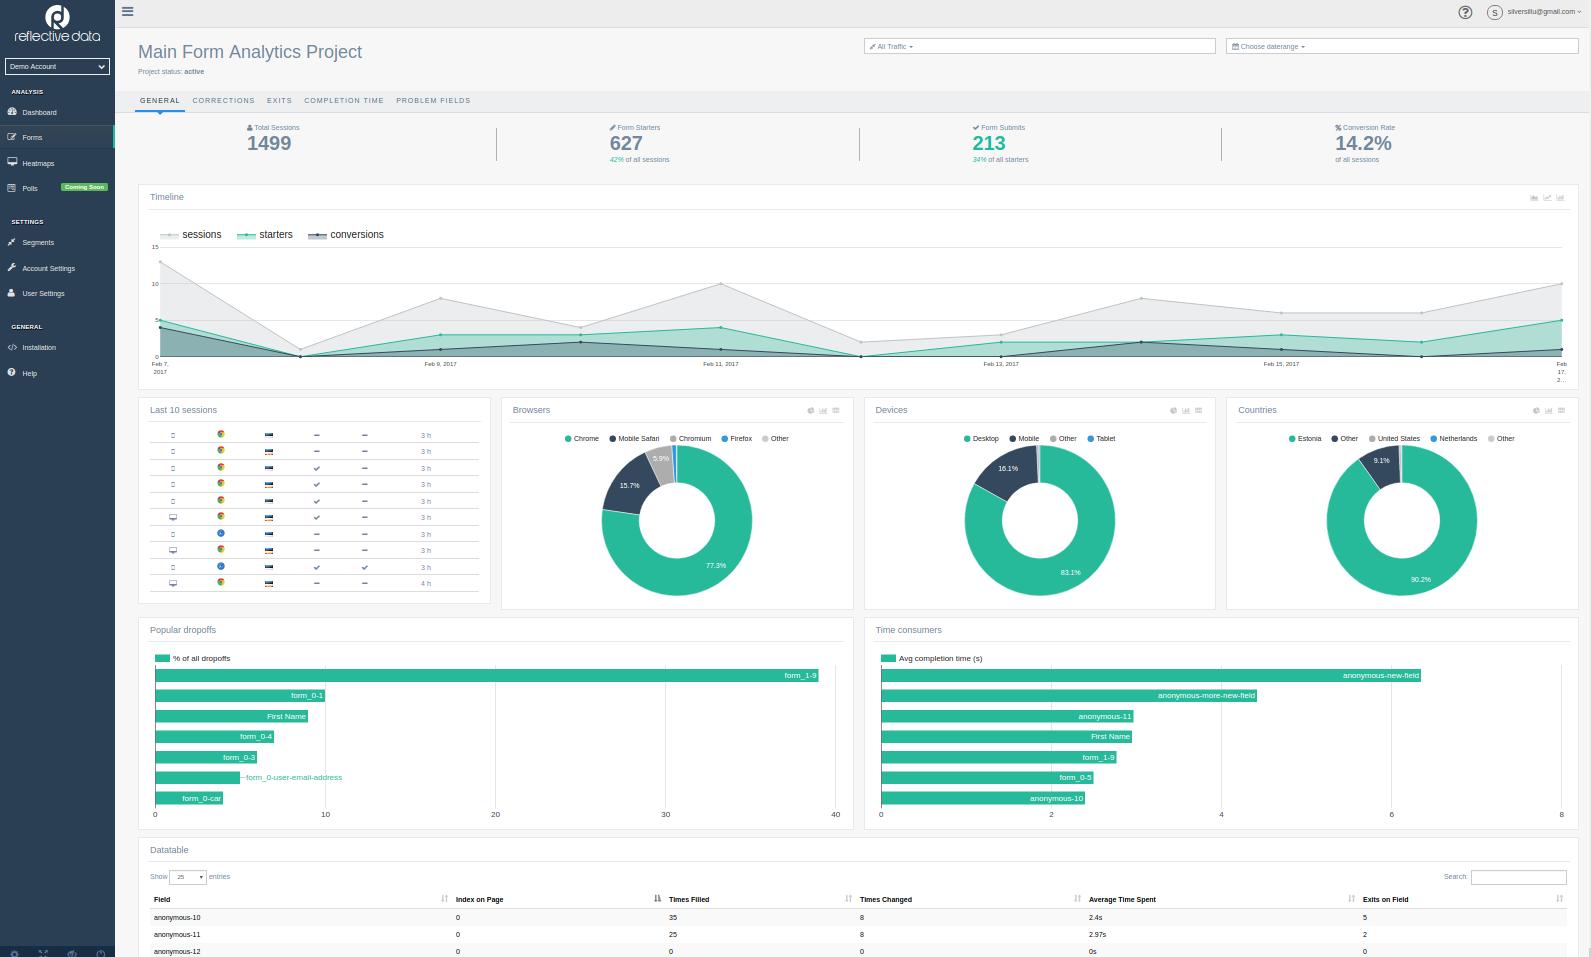
4. Qualitative Analysis (Heatmaps and Recordings)
Quantitative data tells you where the problem is; qualitative data tells you why. Heatmaps reveal what sections of a page capture user attention, while session recordings allow managers to watch real users navigate the site, often uncovering technical bugs that only appear on specific browsers or device types.
5. Closing the Loop with Surveys
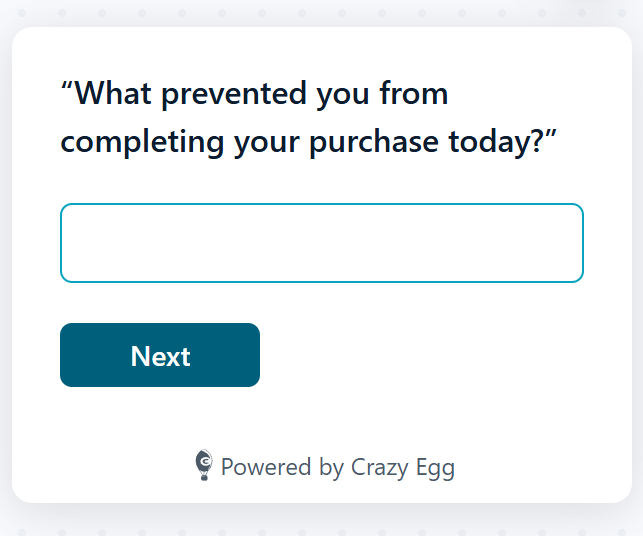
Finally, exit-intent surveys provide the ultimate diagnostic. By asking a simple question—"What is preventing you from completing your purchase today?"—businesses can gather actionable insights directly from the source.

Supporting Data: The Case for Optimization
The necessity of a streamlined user experience is backed by compelling industry research. According to data from 2025 and 2026, minor adjustments can yield massive revenue impacts.
- The Power of Search: Research from Constructor (2024) indicates that while searchers make up only 24% of site traffic, they account for 44% of total revenue, converting at 2.5 times the rate of non-searchers.
- Visual Dominance: Salsify’s 2026 consumer research reveals that 61% of shoppers cite high-quality product images and videos as the most critical element on a product page, surpassing reviews and pricing.
- Trust and Security: Forter’s 2024 Trust Premium Report found that shoppers spend 51% more with retailers they trust, underscoring the ROI of displaying security badges and clear guarantees.
- The Cost of Complexity: Baymard’s 2025 checkout usability studies highlight that 17% of shoppers abandon carts due to overly complex checkout processes, while 18% abandon them if forced to create an account.
14 Strategic Fixes to Plug Funnel Leaks
To turn a store into a conversion engine, experts recommend implementing the following 14 strategies:
Discovery & Search
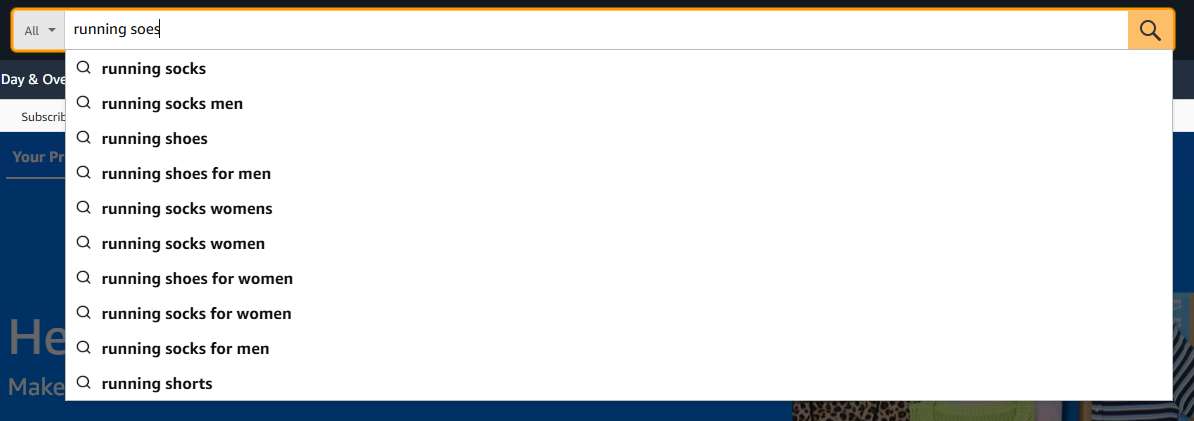
- Optimize On-Site Search: Implement AI-driven search that handles typos, synonyms, and partial matches.
- Intuitive Filtering: Structure category filters based on the vocabulary customers use, not internal jargon.
Product Page Excellence
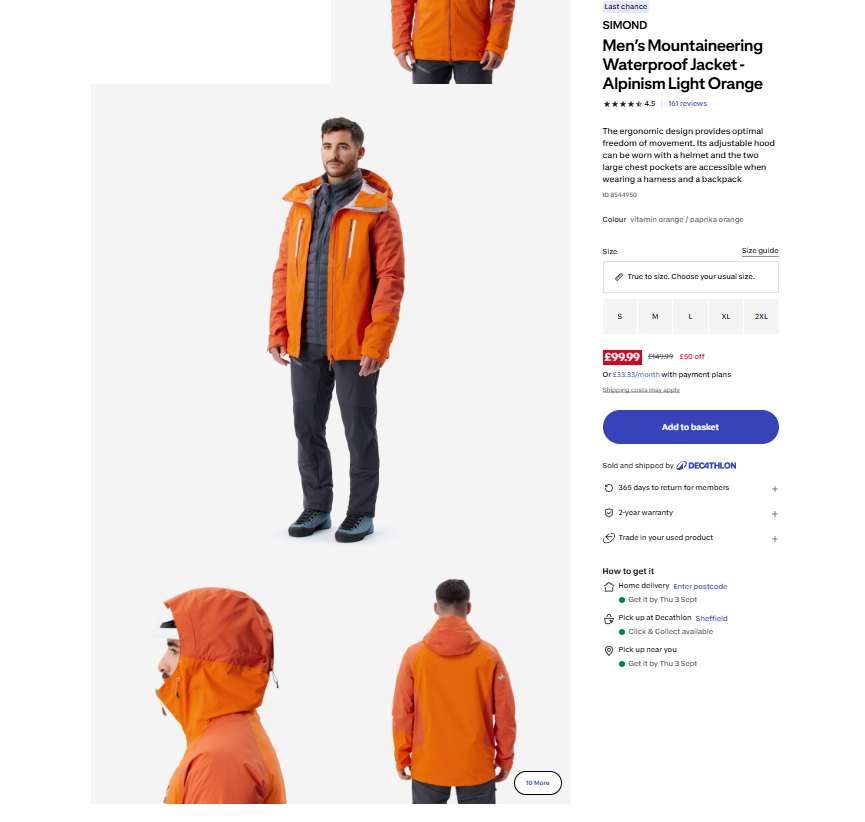
- Visual Quality: Provide zoomable, multi-angle imagery and product videos.
- Detailed Descriptions: Provide comprehensive specifications to minimize "not as described" returns, which accounted for 32% of returns in the UK/EMEA in 2025.
- Build Trust: Display social proof, security badges, and clear return guarantees prominently.
- Transparent Pricing: Show shipping and tax estimates before the cart to avoid the "sticker shock" that leads to 40% of cart abandonments.
Cart & Checkout Optimization
- Guest Checkout: Always default to guest checkout and offer Single Sign-On (SSO) options like Apple or Google Pay.
- Streamlined Forms: Aim for 7-8 fields and utilize address auto-complete to reduce manual entry.
- Progress Indicators: For multi-step checkouts, always show the user where they are and what remains.
- Localized Payments: Offer region-specific payment methods (e.g., BLIK in Poland, iDEAL in the Netherlands) to boost conversion by up to 46%.
- Cart Recovery: Utilize automated email, SMS, and push notification flows to recapture lost leads.
Site-Wide Performance
- AI Personalization: Tailor product recommendations to individual behavior to lift conversions by 15-30%.
- Performance Speed: Aim for a Largest Contentful Paint (LCP) of under 2.5 seconds to meet Core Web Vitals standards.
- Mobile-First Design: Given that 74% of traffic now comes from mobile devices, ensure the checkout process is touch-friendly and lightning-fast.
Implications: The Continuous Loop
The most critical implication for ecommerce managers is that CRO is never finished. As consumer behavior evolves and technology shifts, a site that converts well today may fail tomorrow.
The most successful brands treat CRO as a continuous loop:
- Monitor: Use analytics to detect new leaks.
- Analyze: Use behavior tools to understand the friction.
- Test: Deploy A/B tests to validate potential solutions.
- Implement: Roll out the winners and repeat.
Frequently Asked Questions
How do I calculate my ecommerce conversion rate?
The formula is: (Total Orders / Total Sessions) x 100. For example, 150 orders from 5,000 sessions result in a 3% conversion rate.
What is a "good" conversion rate?
While the average sits around 2.5-3%, this varies wildly by industry. Luxury items may hover near 0.5%, while essential pet supplies may see rates as high as 7%.
What is the difference between micro and macro conversions?
Macro conversions are the "big" goals, like a completed purchase. Micro conversions are the incremental steps, such as adding an item to a wishlist, signing up for a newsletter, or viewing a product video.
Does Amazon set a different standard?
Yes. Amazon retailers often see conversion rates between 8-15%, largely due to the high level of buyer intent and the established trust consumers have in the Amazon platform. Independent retailers should focus on building that same level of trust through transparency and superior user experience.
