

The Anatomy of Performance: 10 Essential Metrics for Landing Page Optimization
Last Modified: March 19, 2025
In the vast digital marketplace, your website is your storefront, and your landing pages are the window displays designed to capture the attention of passersby. Just as a physical storefront’s design dictates whether a potential customer steps inside or continues walking, a landing page serves as the make-or-break point for digital engagement. It is often the first, and sometimes the only, impression a visitor has of your brand.
Because digital marketers invest significant capital into driving traffic through SEO, paid search, and social media campaigns, the landing page is not merely a destination—it is a critical investment vehicle. Understanding how to measure the performance of these pages is no longer a luxury; it is a fundamental requirement for any business looking to maximize its return on investment (ROI).
This guide explores the top 10 metrics you must track to transform your landing pages into high-converting assets, regardless of the analytics platform you utilize.
1. The Foundation: Traffic Sources
Before dissecting specific performance metrics, one must first account for the origin of the audience. Traffic sources are not a standalone metric, but they provide the essential context for every other data point you collect.

By segmenting your data by source—such as Paid Search, Organic Social, or Email—you can identify which channels yield the highest-quality visitors. For instance, if your data reveals that Paid Search campaigns exhibit a high bounce rate despite significant budget allocation, it acts as an immediate red flag. It allows you to pivot your strategy, potentially diverting funds to higher-performing channels like Paid Social, while simultaneously signaling that your Paid Search copy or keyword targeting requires urgent optimization.
2. Conversion Rate (CR)
The ultimate objective of any landing page is to convert—whether that means securing a lead, facilitating a purchase, or driving a newsletter signup. The Conversion Rate (CR) is the definitive measure of this success.
The Formula: (Total Conversions / Total Visitors) 100*
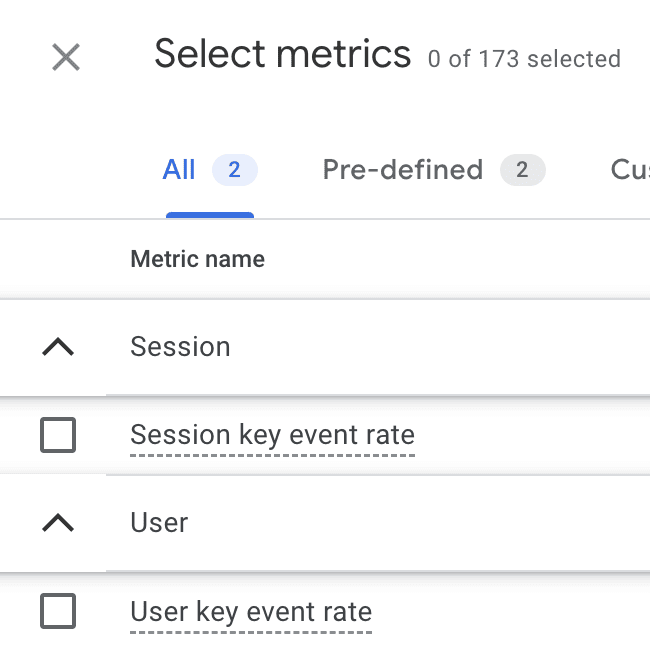
While industry benchmarks provide a useful baseline, it is vital to remember that conversion rates are deeply nuanced. They fluctuate based on industry, product price point, and geographic location. To gain a competitive edge, perform a deep dive by segmenting CR by device type or visitor status (new vs. returning). For those leveraging Google Analytics 4 (GA4), focusing on "Key Event Rates" within the Explorations tab provides a more precise look at how specific user actions drive business value.
3. Bounce Rate: Understanding Engagement Gaps
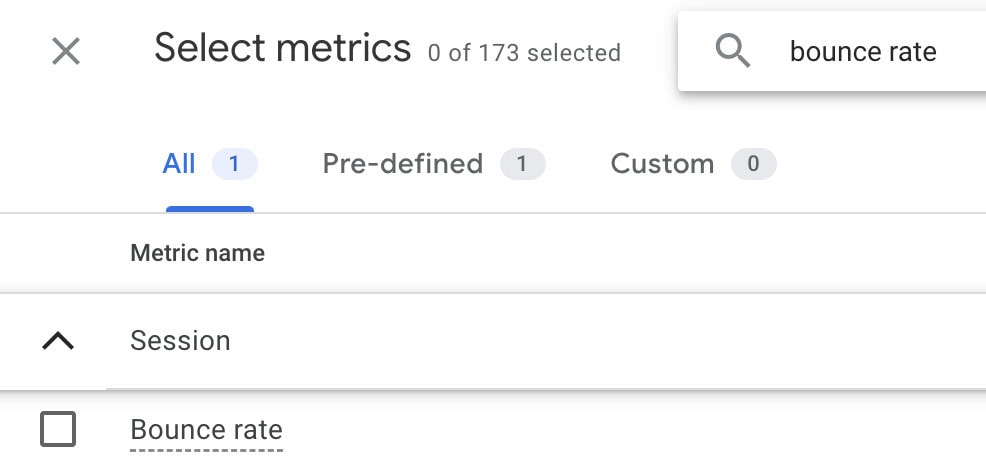
Bounce rate remains one of the most critical indicators of user satisfaction. It measures the percentage of visitors who enter your site and exit without interacting with a second page or triggering an event.

The Formula: (Sessions with one page / Total Sessions) 100*
A bounce rate of 100% or 0% often indicates a tracking error, but high bounce rates generally point toward friction. When users bounce too soon, it signals a mismatch between the ad copy and the landing page content, poor page load speed, or a confusing user interface. While a 26% to 70% range is common, high-intent pages should aim for the lower end of that spectrum.
4. Average Engagement Time
Time spent on a page is a double-edged sword. If you are selling a high-value, complex service, you want users to spend time digesting the information. Conversely, if you are running a simple lead-gen page, high time-on-page could indicate that users are struggling to locate your call-to-action (CTA).
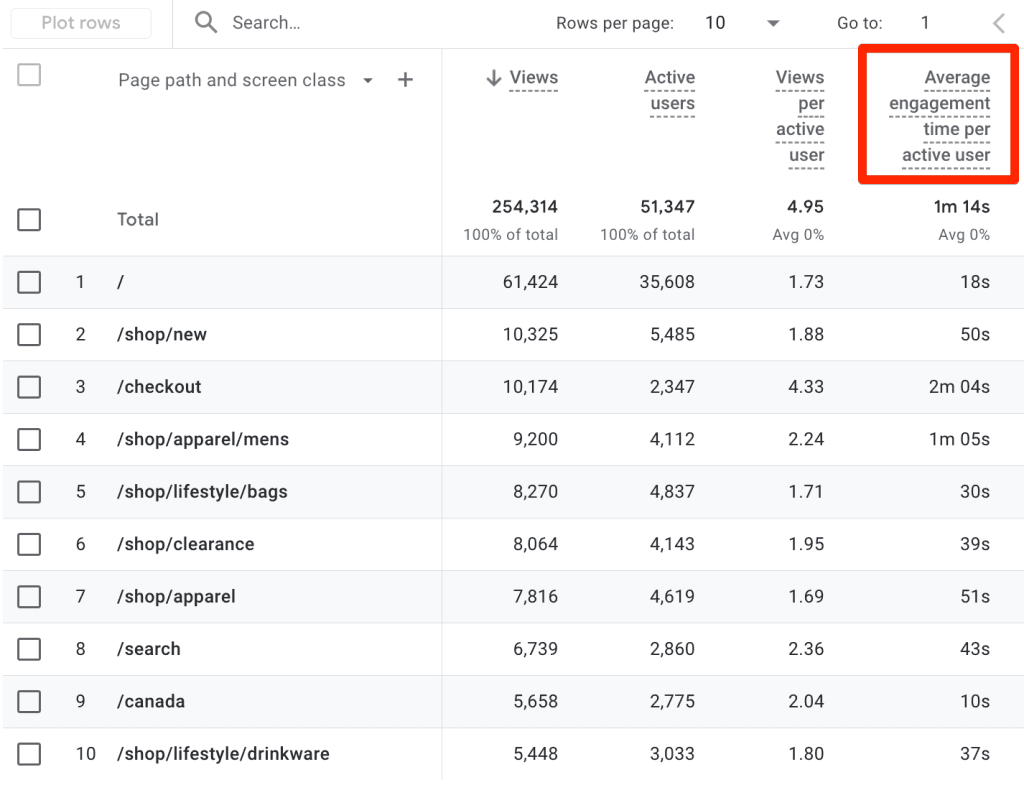
In GA4, "Average Engagement Time" replaces older, less accurate duration metrics. Use this to determine if your content is effectively guiding the user. If the time is too low, your messaging may be failing to resonate; if it is too high, you likely have a UX bottleneck.
5. Form Abandonment Rate
For B2B companies, the form is the most important element on the page. Form abandonment occurs when a user initiates the process but fails to hit "submit."
The Formula: (Form Started – Form Completed) / Form Started 100*
High abandonment rates are often the result of "form fatigue"—requesting too much information, using confusing field labels, or failing to communicate the value of the submission. By tracking this metric, you can identify the exact point of drop-off and simplify the user journey accordingly.
6. Cost Per Conversion (CPC)
Marketing is a financial game. If you are pouring $5,000 into a campaign that generates five leads, your cost per lead is $1,000. Is that sustainable?
The Formula: Total Marketing Cost / Total Conversions
Your cost per conversion must remain significantly lower than the Customer Lifetime Value (CLV). If the metric trends upward, you are effectively eroding your profit margins. Regularly auditing this metric ensures that your landing page performance is aligned with your overarching financial goals.
7. Exit Rate vs. Bounce Rate
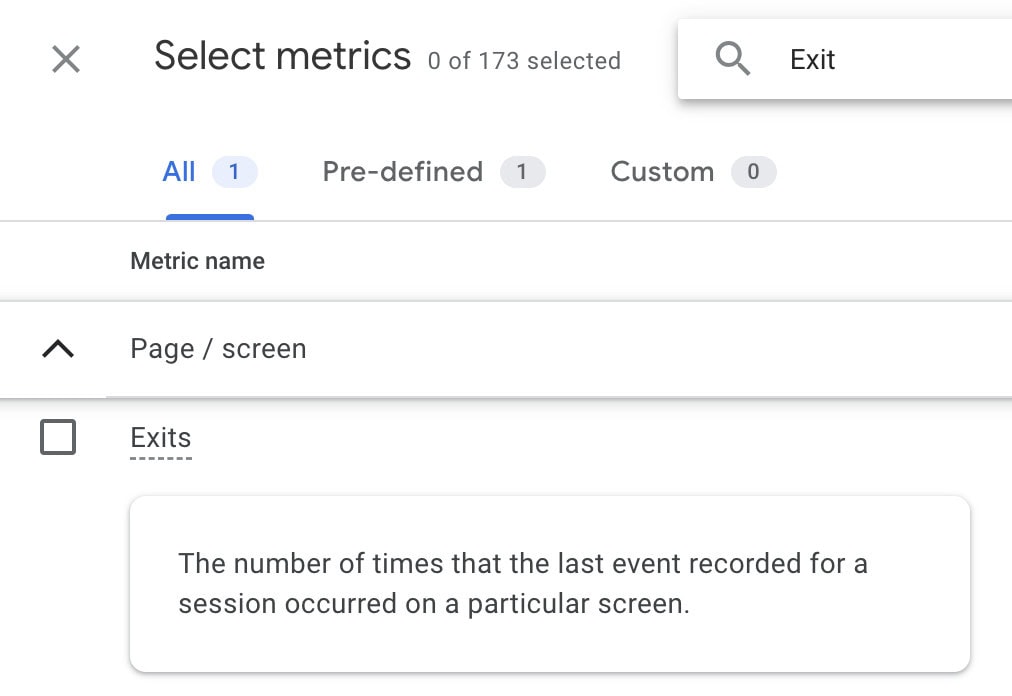
It is a common error to conflate these two. A "bounce" is a single-page session. An "exit" occurs when a user leaves the site after interacting with multiple pages.
High exit rates on a landing page that is meant to serve as a bridge to other content (like a product catalog or pricing page) are alarming. It suggests that while the user was interested enough to click, the secondary pages failed to sustain their interest. You must analyze the entire flow, not just the landing page in isolation.
8. Scroll Depth
Vertical scrolling metrics allow you to understand how much of your story is actually being read. By tracking the percentage of the page viewed (10%, 25%, 50%, etc.), you can place critical assets—such as testimonials, security badges, and primary CTAs—in the "sweet spot" where users are most likely to see them. If your data shows that 80% of users drop off before reaching the 50% scroll mark, move your primary call to action higher up the page.
9. Click-Through Rate (CTR)
CTR is the health check for your design and copy. It measures how effectively your CTAs (buttons, links, or image banners) are compelling users to take the next step.
The Formula: (Total Clicks / Total Impressions) 100*
A low CTR is rarely a technical issue; it is almost always a messaging or trust issue. If the copy is uninspiring or the design looks untrustworthy, users will not click. A sudden dip in CTR should trigger an immediate review of your page functionality to ensure that buttons are not broken or obscured by mobile-responsive layout errors.
10. New vs. Returning Visitors
Returning visitors are a sign of brand resonance, while new visitors are a sign of successful acquisition. By segmenting these two groups, you can tailor your landing pages. Perhaps new visitors need more educational content to build trust, while returning visitors are ready for a hard "Sign Up" or "Buy Now" push. Combining this metric with conversion rate data allows for advanced personalization strategies that improve overall site performance.
Implications for the Modern Marketer
The metrics listed above are not merely numbers in a dashboard; they are the "why" behind the "what" of your marketing performance.
Chronology of Optimization:
- Initial Deployment: Launch with clear, hypothesis-driven messaging.
- Data Collection: Allow enough traffic (at least 100–500 sessions) to reach statistical significance.
- Segmentation: Review the metrics by traffic source and device.
- Qualitative Audit: Use tools like Hotjar or Microsoft Clarity to watch session recordings and view heatmaps.
- Iteration: Implement A/B tests based on the identified friction points.
Expert Perspective: Moving Beyond the Numbers
While quantitative metrics provide the framework, the most successful marketers combine these with qualitative insights. As industry experts note, numbers show you where the problem lies, but user testing and exit-intent surveys show you why.
When your conversion rate stalls, do not just tweak the button color. Conduct a user interview or analyze a session recording. Are users confused by the pricing? Is the form mobile-unresponsive? Does the page take too long to load on 4G networks?
By maintaining a holistic view of your landing page—balancing hard data with user experience insights—you move beyond simple tracking and into the realm of true optimization. The goal is not just to reduce the bounce rate, but to build a digital experience that respects the user’s time and delivers on the promise of your brand.
As you refine your approach, remember: the data is there to guide you, but the user experience is what ultimately drives the conversion. Start tracking these 10 metrics today, and transform your landing pages from static displays into your most powerful sales tools.
