

The Science of First Impressions: 10 Essential Metrics for Mastering Landing Page Performance
Last Modified: March 19, 2025
In the vast digital marketplace, your website is your storefront, but your landing page is the window display. Much like a physical shop, the aesthetic appeal, clarity, and relevance of this display determine whether a passerby becomes a customer or keeps walking. In an era where digital attention spans are measured in seconds, the landing page serves as the ultimate arbiter of brand engagement. If a user’s first encounter is lackluster, it is often their last.
For digital marketers, the stakes are exceptionally high. Significant capital is routinely funneled into paid advertising and search engine optimization (SEO) to drive traffic to these specific gateways. Failing to monitor how that traffic behaves is akin to paying for a billboard and refusing to check if anyone is actually reading it. To maximize return on investment (ROI), marketers must move beyond surface-level vanity metrics and adopt a rigorous, data-driven framework for evaluating landing page performance.
1. The Foundation: Traffic Sources
While not a performance metric in the traditional sense, understanding your Traffic Sources is the foundational bedrock of all analytics. Before assessing how a page performs, you must know where your visitors originate. Are they arriving via organic search, paid social media campaigns, or direct referrals?
By segmenting your metrics by traffic source, you gain granular insights into campaign efficacy. For instance, if data reveals that Paid Search traffic has a high bounce rate while Paid Social traffic leads to consistent conversions, you are empowered to shift your budget allocation toward the more profitable channel. This diagnostic approach allows you to optimize not just the landing page, but the entire acquisition funnel, ensuring that your marketing spend is directed toward the audiences most likely to convert.

2. Conversion Rate (CR)
The primary objective of most landing pages is to facilitate a specific action—whether that is a form submission, a newsletter signup, or a direct purchase. The Conversion Rate (CR) is the definitive barometer of this objective.
Formula: (Total Conversions / Total Visitors) 100*
Benchmarking your CR against industry standards is essential, though context is king. A B2B enterprise SaaS company will naturally have a different conversion profile than a B2C e-commerce outlet. Furthermore, analyzing CR by visitor type—distinguishing between new and returning users—provides deeper insights. New visitors may require more educational content to build trust, whereas returning visitors might be closer to a purchase decision. Tools like Google Analytics 4 (GA4) allow for the tracking of "key events," providing a robust view of how successfully your page facilitates these critical milestones.
3. Bounce Rate: The Engagement Litmus Test
The Bounce Rate represents the percentage of users who arrive at your landing page and depart without taking any further action or interacting with the site. A high bounce rate often acts as an "early warning system" for usability issues.
Formula: (Sessions with one page / Total Sessions) 100*
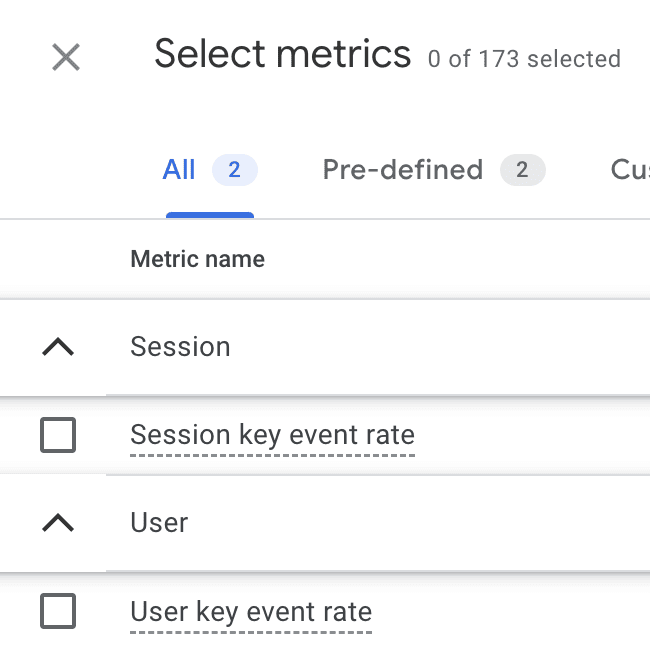
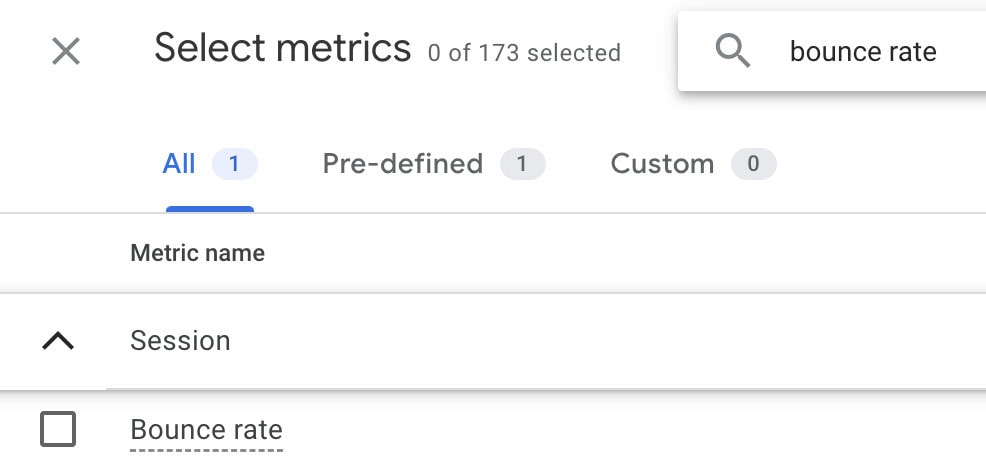
While an industry-average bounce rate typically fluctuates between 26% and 70%, these numbers vary wildly based on page type. A blog post, designed for reading, may naturally have a higher bounce rate than a high-intent product page. If you encounter a bounce rate below 20%, it may be an indication of a tracking error rather than exceptional performance. Investigating why users leave—whether due to slow load times, mismatched ad messaging, or poor mobile responsiveness—is a critical step in the iterative optimization process.
4. Average Time on Page (Engagement Duration)
Average Time on Page provides context to the user experience. However, "longer" is not always "better."
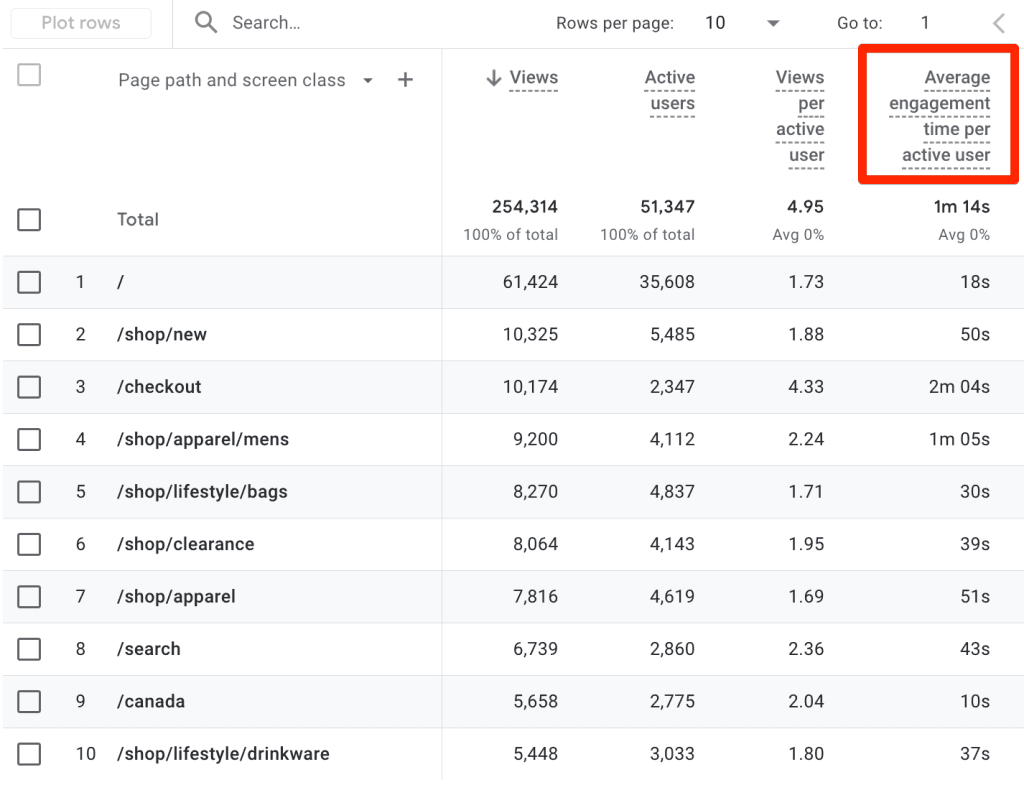
If you are selling a complex, high-ticket service, a longer duration is usually a positive signal that the user is digesting the value proposition. Conversely, if your landing page is designed for a quick, simple action—such as downloading a whitepaper—a high time-on-page metric might indicate that the user is struggling to find the call-to-action (CTA) or that the page layout is confusing. By monitoring GA4’s "Average Engagement Time," you can discern whether your content is effectively guiding the user or merely overwhelming them.
5. Form Abandonment Rate
For pages reliant on lead generation, the Form Abandonment Rate is perhaps the most painful metric to watch. It quantifies the gap between intent and action.
Formula: (Form Started – Form Completed) / Form Started 100*
A high abandonment rate is a flashing red light suggesting friction. Is the form too long? Are you asking for sensitive information too early in the relationship? Are there technical glitches preventing submission? By isolating the abandonment point, marketers can implement A/B testing—such as reducing the number of fields or adding progress bars—to drastically improve completion rates.
6. Cost Per Conversion (CPC)
In the world of paid advertising, the Cost Per Conversion is the ultimate metric for profitability. It links your analytics directly to your bottom line.
Formula: Marketing Cost ($) / Total Conversions
If you spend $2,500 on an ad campaign that yields 121 conversions, your cost per acquisition is approximately $20.67. If the lifetime value (LTV) of that customer is significantly higher, your strategy is sound. If the cost exceeds the value of the conversion, the landing page or the ad targeting is economically unsustainable. This metric forces a business-first mindset, ensuring that every dollar spent is contributing to growth.
7. Exit Rate vs. Bounce Rate
Understanding the difference between Exit Rate and Bounce Rate is vital for accurate data interpretation. While a bounce occurs when a user leaves after viewing only one page, an exit happens when a user leaves after viewing multiple pages.
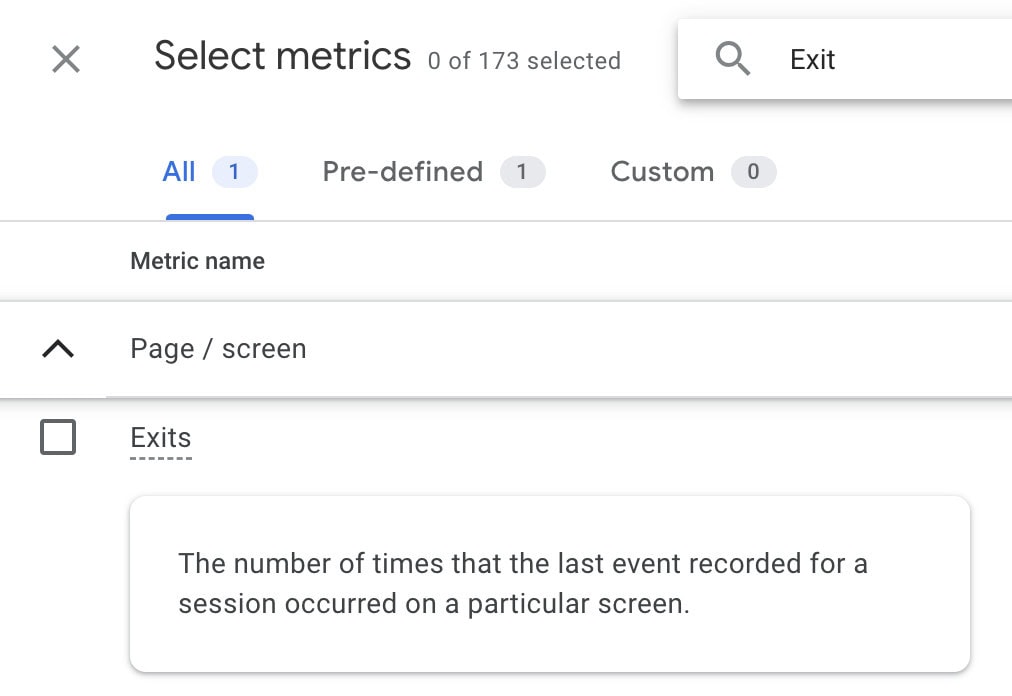
The exit rate for a specific page is calculated as: (Number of Exits / Total Pageviews) 100*. If a landing page is intended to be a gateway to other areas of the site, a high exit rate indicates a failure in internal navigation or content relevance. Analyzing exit paths allows you to identify which pages are effectively "leaking" traffic and where you need to reinforce your internal linking strategy.
8. Scroll Depth: Mapping Engagement
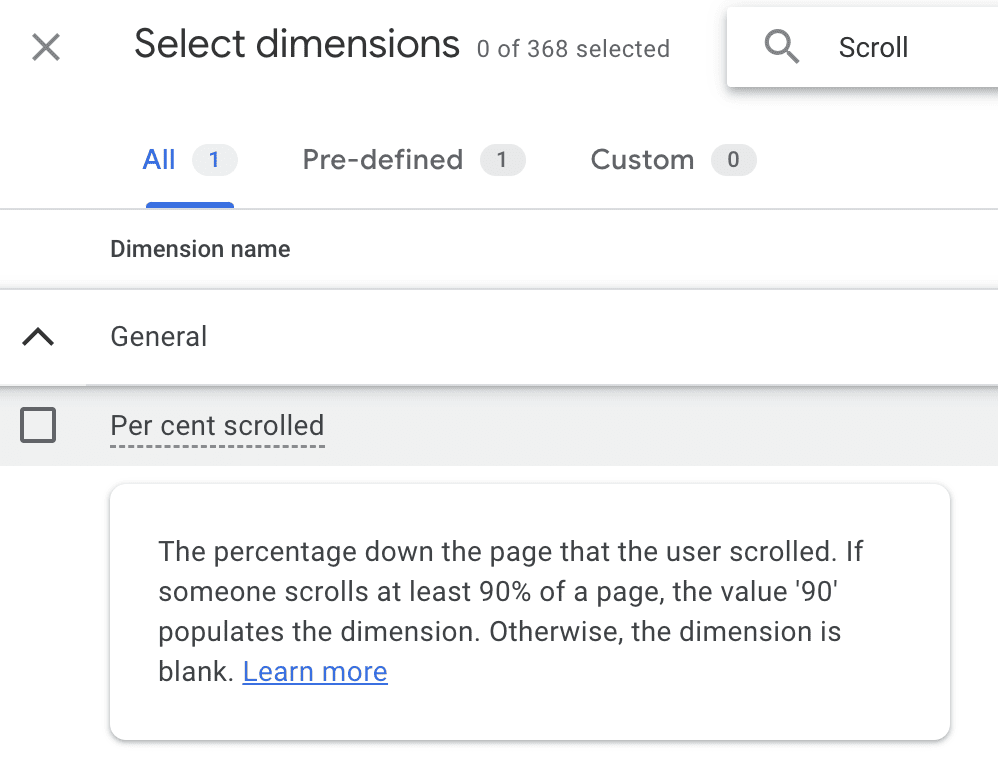
Scroll Depth measures how far a user descends down the page. In an era of long-form landing pages, understanding whether users are seeing your social proof, security badges, or secondary CTAs is critical.
If heatmaps or scroll-depth metrics reveal that 90% of your users never reach the bottom half of the page, you are burying your most important assets. By tracking this engagement metric, you can strategically reposition key elements to ensure they appear within the "above the fold" or "most viewed" segments of your page.
9. Click-Through Rate (CTR)
The Click-Through Rate (CTR) of your on-page elements (buttons, links, banners) tells you how compelling your design and copy truly are.
Formula: (Total Clicks / Total Impressions) 100*
A healthy CTR validates that your messaging resonates with the audience. A sudden decline in CTR on a previously high-performing button can be a diagnostic indicator that a link is broken or that a visual element is failing to render correctly on specific devices. It is a direct measurement of the effectiveness of your "call to action."
10. New vs. Returning Visitors
Analyzing the behavior of New vs. Returning Visitors allows for a sophisticated understanding of your sales cycle. Returning visitors often signify a brand that has built trust, or a product that requires a longer consideration phase.
By pairing this metric with others—such as comparing the conversion rates of first-time visitors against repeat visitors—you can tailor your content. Perhaps you offer a discount code to new visitors to lower the barrier to entry, while offering case studies or testimonials to returning visitors to cement their decision.
Implications for Future Strategy: The Holistic View
While these 10 metrics provide a comprehensive snapshot of performance, they should never be viewed in isolation. The true power of web analytics lies in the synthesis of data.
The Role of Qualitative Analysis
Numbers tell you what is happening; they do not always tell you why. To bridge this gap, modern marketers must supplement quantitative metrics with qualitative tools such as session recordings, heatmaps, and user testing. If your bounce rate is high, a session recording might reveal that your page is breaking on a specific browser, or that a popup is obscuring the content.
The Path Forward
Ultimately, the goal of tracking these metrics is optimization. By establishing a culture of testing, you can move from intuition-based design to evidence-based growth. Whether it is refining your traffic sources to improve lead quality or streamlining your forms to reduce abandonment, the data is your most reliable compass.
As you look to the future of your landing page strategy, remember: the metrics you choose to prioritize should always align with your primary business goals. Engage your team, audit your current analytics setup, and start the iterative process of turning your landing pages into high-converting assets. What metrics are you tracking today to drive your success? The conversation begins with the data.
