

Optimizing Digital Gateways: The 10 Essential Metrics for Landing Page Success
Last Modified on March 19, 2025
In the expansive digital landscape, a website serves as a brand’s comprehensive storefront, showcasing its entire range of offerings and information. Within this digital storefront, landing pages function as meticulously curated display windows, designed to capture immediate attention and guide potential customers towards a specific, desired action. Just as a captivating shop window can entice a passerby to step inside, a well-optimized landing page holds the power to convert a fleeting visitor into an engaged lead or a loyal customer. Conversely, a poorly designed or underperforming landing page can lead to immediate disengagement, causing visitors to "bounce" away, potentially never to return.
This critical first impression underscores the paramount importance of landing pages. They are often the inaugural point of contact a user has with a brand, acting as the front line of digital marketing campaigns. If this initial interaction fails to resonate, it can swiftly become their last, regardless of the significant investment made to attract them. Digital marketers routinely allocate substantial budgets to drive traffic to these pages through diverse channels, including sophisticated ad campaigns, strategic search engine optimization (SEO) efforts, and targeted social media promotions. Given this considerable expenditure and the high stakes involved, a profound understanding of user behavior on these pages and the ability to accurately measure their performance is not merely beneficial, but absolutely essential for maximizing return on investment (ROI).
This comprehensive guide will delve into the 10 most critical landing page metrics that every marketer and business owner must track. Regardless of the specific analytics tool employed – be it Google Analytics 4 (GA4) or another platform – these metrics provide invaluable insights into user engagement, conversion efficiency, and overall campaign effectiveness. By meticulously monitoring and analyzing these indicators, businesses can identify areas for improvement, refine their strategies, and transform their landing pages into powerful conversion engines.
Let’s dive into the core measurements that define landing page triumph.
Understanding the Foundation: Beyond Just Metrics
Before dissecting individual metrics, it’s crucial to acknowledge the foundational context that often precedes and influences them: traffic sources. While not a metric in itself, understanding where your visitors originate provides indispensable information for interpreting performance data and making informed strategic decisions.
1. Traffic Sources: The Origin Story of Your Visitors
Main Facts: Traffic sources categorize how users arrive at your landing page. These typically include Organic Search (from search engines like Google), Paid Search (ads on search engines), Paid Social (ads on social media platforms), Referral (links from other websites), Direct (typing URL directly), and Email (from email campaigns).

Implications: Analyzing traffic sources in conjunction with other metrics offers a panoramic view of campaign efficacy. For instance, if a landing page shows a low conversion rate for Paid Search traffic but a significantly higher rate for Paid Social, this immediately signals a potential issue with the Paid Search campaign. It could indicate misaligned ad copy, incorrect targeting, or a disconnect between the ad’s promise and the landing page’s content. Such an insight empowers marketers to divert budget from underperforming channels to more successful ones, or, more strategically, to investigate and optimize the underperforming campaigns.
Supporting Data: By segmenting all subsequent metrics by traffic source, you can answer critical questions:
- Which channels deliver the most qualified leads?
- Are certain channels attracting users with higher intent?
- Do different channels require tailored landing page experiences?
This granular analysis allows for precise optimization, ensuring that marketing efforts are directed towards the most effective avenues, thereby maximizing efficiency and ROI across the entire digital marketing ecosystem.
Core Performance Indicators: Measuring Success and Identifying Gaps
Once you understand where your traffic is coming from, the next step is to measure what those visitors do once they arrive. These metrics are the heartbeat of your landing page performance.
2. Conversion Rate: The Ultimate Goal Achieved
Main Facts: The conversion rate (CR) is arguably the most vital metric for any landing page. It quantifies the percentage of visitors who complete a desired action, such as submitting a form, making a purchase, downloading an asset, signing up for a newsletter, or requesting a demo.
Formula:
Total Conversions / Total Visitors * 100
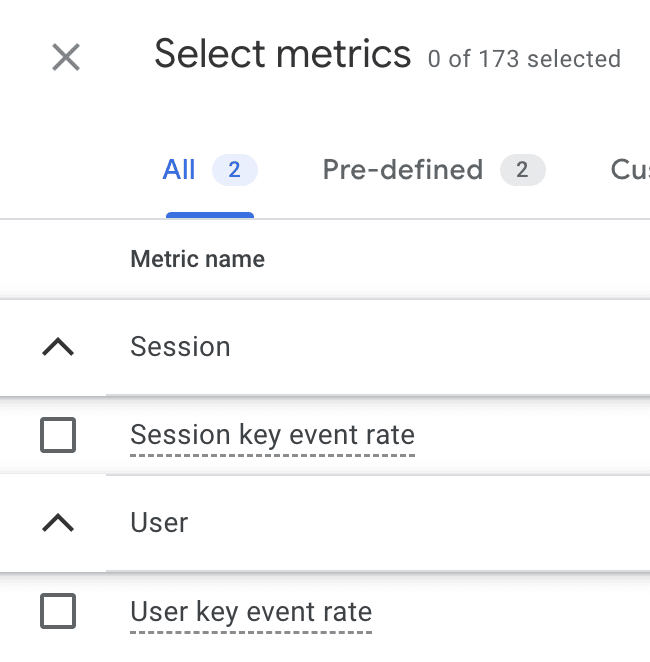
Supporting Data: This calculation can be applied to a single, specific conversion event or encompass all defined conversion events on a page. Google Analytics 4 (GA4) provides "Key Event Rates" (session and user conversion rates) which directly reflect this metric.
Implications: A high conversion rate indicates that your landing page is effectively persuading visitors to take the intended action. Conversely, a low rate suggests friction points or a mismatch between user expectations and page content. By comparing CR across different landing pages, marketers can identify top performers and analyze what elements contribute to their success (e.g., compelling headlines, clear CTAs, strong social proof, intuitive design). Diving deeper, segmenting CR by traffic source, device type, or even messaging variations can reveal specific optimization opportunities.

Official Responses/Best Practices: While industry average conversion rates (often cited between 2-5% for B2B and higher for some B2C e-commerce) serve as a general benchmark, it’s crucial to establish internal benchmarks specific to your business, industry niche, and even the specific goal of the landing page. A high-value product or service, for example, might naturally have a lower conversion rate due to a longer decision-making process. Moreover, analyzing conversion rates for new versus returning visitors can reveal different engagement patterns, potentially leading to tailored strategies for each segment. Returning visitors, already familiar with your brand, might convert at a higher rate if the page provides the specific information they seek to finalize a decision.
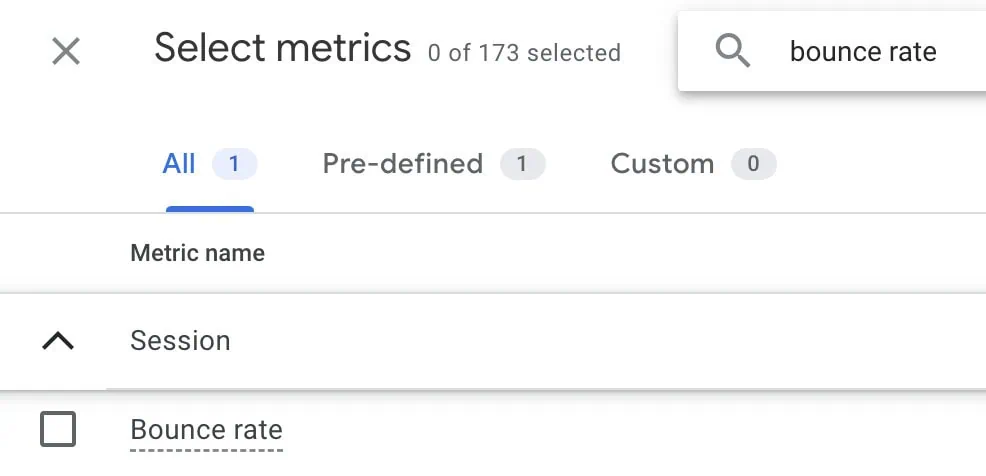
3. Bounce Rate: The Immediate Exit
Main Facts: Bounce rate measures the percentage of visitors who land on a page and leave without interacting further or navigating to another page on your site. It is a key indicator of initial engagement (or lack thereof).
Formula:
Sessions with one page / Total Sessions * 100
Supporting Data: In GA4, while "bounce rate" is often presented as the inverse of "engagement rate" (where an engaged session lasts longer than 10 seconds, has a conversion event, or has two or more page views), the traditional definition of a single-page session is still a powerful diagnostic tool, retrievable through custom reports or explorations.
Implications: A high bounce rate (e.g., above 70%) on a conversion-focused landing page is typically a red flag. It can signify:
- Misaligned expectations: The ad or link promising something different from what the landing page delivers.
- Poor user experience (UX): Slow loading times, confusing layout, non-responsive design on mobile.
- Irrelevant content: The page content doesn’t address the user’s needs or search query.
- Technical issues: Broken forms, non-functional buttons, or other errors preventing interaction.
However, context is vital. A high bounce rate on a blog post or a contact page where users find the information they need and then leave might be acceptable, as their primary goal was met on that single page. Conversely, an abnormally low bounce rate (e.g., below 20%) with significant traffic could indicate a tracking issue (e.g., duplicate analytics code).
Official Responses/Best Practices: Industry benchmarks for bounce rate vary widely, typically ranging from 26% to 70% depending on the industry, page type (e.g., blogs often have higher bounce rates), and device. The goal is generally to keep bounce rates as low as possible for conversion-oriented pages by ensuring clear messaging, fast load times, intuitive design, and a compelling call to action that matches the user’s initial intent.
4. Average Time on Page / Average Engagement Time: How Long Do They Stay?
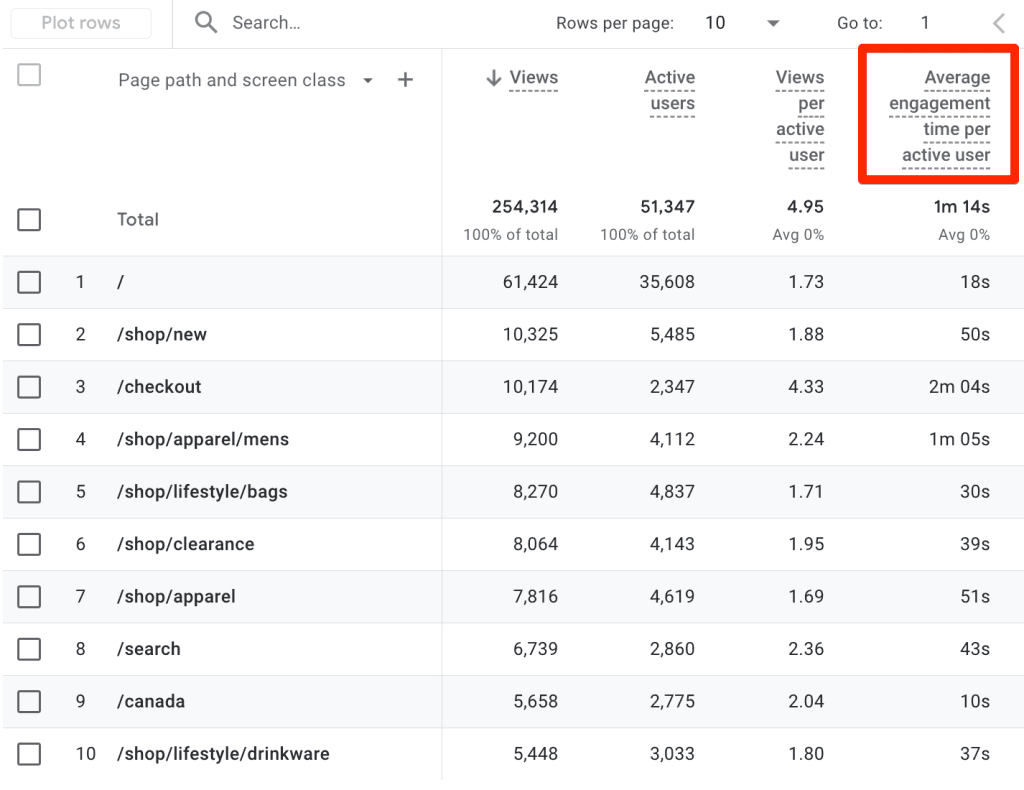
Main Facts: This metric indicates the average duration visitors spend actively viewing and interacting with a specific landing page. In GA4, "Average Engagement Time" is the equivalent, focusing on active user time rather than just open page time.
Supporting Data: GA4’s "Pages and screens" report often displays Average Engagement Time, providing a more accurate measure of user interest.
Implications: The interpretation of "Average Time on Page" is highly contextual.
- High-Value/Complex Products: For landing pages selling complex software, high-ticket items, or offering extensive educational content, a longer average time on page is generally positive. It suggests visitors are deeply engaging with the information, trying to understand the value proposition, or consuming detailed content. If time on page is unexpectedly low in such scenarios, it could signal that the content is not engaging, the layout is confusing, or users are struggling to find relevant information.
- Simple Forms/Quick Actions: For landing pages designed for quick lead capture with minimal text, a shorter average time on page is expected and often desirable, indicating efficiency. If the time is unusually long, it might point to friction points in the form, confusing instructions, or technical glitches preventing quick submission.
Official Responses/Best Practices: Analyze this metric in conjunction with bounce rate and conversion rate. A long time on page without a conversion could mean users are interested but facing an obstacle, while a short time on page with a conversion indicates efficiency. Use this data to refine content, simplify complex sections, or ensure CTAs are prominently placed.
5. Form Abandonment Rate: The Unfinished Journey
Main Facts: Specific to landing pages featuring forms (e.g., lead capture, registration, contact forms), the form abandonment rate measures the percentage of users who start filling out a form but do not complete and submit it.
Formula:
(Form started (Users) – Form completions (Users)) / Form started (Users) * 100
Alternatively: 1 – Form completion rate (where completion rate = Form completions / Form started)
Example: If 600 users begin a form and 240 complete it:
(600 – 240) / 600 * 100 = 60% abandonment rate
Supporting Data: Tracking this requires setting up specific events for "form start" and "form complete" in your analytics tool (e.g., GA4 custom events). Many dedicated form analytics tools also provide this metric natively.
Implications: A high form abandonment rate (e.g., above 40-50%) reveals significant friction points in your lead generation process. Common culprits include:
- Form Length: Too many required fields can overwhelm users.
- Complexity: Confusing questions or unclear field labels.
- Privacy Concerns: Lack of assurance about data usage.
- Technical Errors: Form validation issues or broken submission buttons.
- Lack of Value Proposition: Users don’t perceive enough value in completing the form.
Official Responses/Best Practices: Optimizing forms involves simplifying questions, using progress bars for multi-step forms, adding clear error messages, providing privacy assurances, and ensuring mobile responsiveness. A/B testing different form layouts, field counts, and copy can significantly reduce abandonment and boost lead generation.
6. Cost Per Conversion (CPC): The Price of Success
Main Facts: For landing pages driven by paid marketing efforts (e.g., Google Ads, social media ads, display ads), Cost Per Conversion (CPC), sometimes referred to as Cost Per Acquisition (CPA), measures the financial expenditure required to achieve a single conversion.
Formula:
Total Marketing Cost ($) / Total Conversions
Example: If you spend $2,500 on a campaign and achieve 121 conversions:
$2500 / 121 = $20.67 Cost Per Conversion
Implications: CPC is a critical financial metric for evaluating campaign profitability and efficiency. If your CPC exceeds the average value or profit generated by each conversion, your campaign is unsustainable. High CPC indicates that your paid traffic is either expensive, the landing page is not converting effectively, or both.
Official Responses/Best Practices: Continuously monitor CPC across different campaigns and landing pages. Compare it against your customer lifetime value (CLTV) or average order value (AOV) to ensure a healthy ROI. Optimizing CPC involves refining ad targeting, improving ad copy, enhancing landing page relevance, and continuously A/B testing elements that influence conversion rate. Integrating ad platform data with GA4 allows for a holistic view of campaign performance and cost efficiency.
Deeper Engagement and User Journey Insights
Beyond the immediate conversion, understanding how users navigate and interact with your page provides critical insights for continuous improvement.
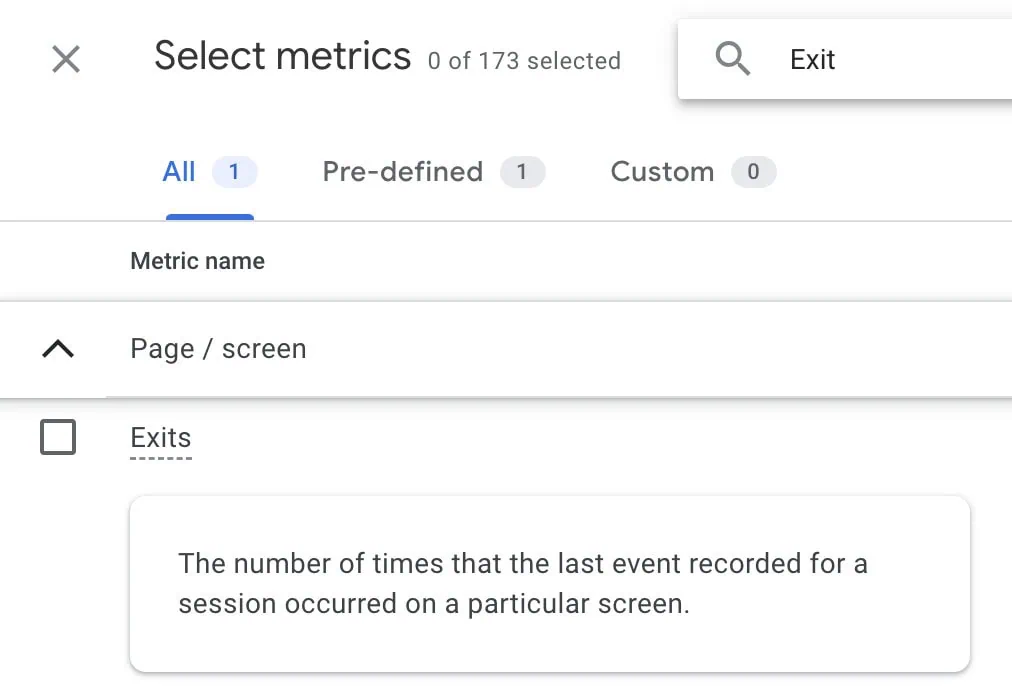
7. Exit Rate: The Last Page in a Session
Main Facts: While often confused with bounce rate, exit rate is distinct. It measures the percentage of sessions that end on a specific page, regardless of how many pages the user visited before exiting. A page can have a high exit rate even if users interacted with multiple pages on your site.
Formula:
Number of Exits from Page / Total Pageviews for Page * 100
Supporting Data: In GA4, "Exits" is available as a metric. To calculate the rate, you might need to export data to external tools like Google Sheets or Looker Studio, or create a custom metric within GA4’s explorations.
Implications: The interpretation of exit rate depends heavily on the page’s role in the user journey.
- Problematic High Exit Rate: If a high exit rate occurs on a critical conversion page (e.g., a product page before checkout, a lead form page), it suggests friction points preventing users from moving forward. This could be due to unexpected costs, complicated processes, or a lack of trust.
- Acceptable High Exit Rate: A high exit rate is expected and even desirable on "thank you" pages or confirmation pages, as users have completed their desired action and naturally leave the site. Similarly, if a landing page is designed to guide users to other specific pages, a high exit rate on the landing page itself might indicate a failure to guide, while a high exit rate on the final destination page would be more concerning.
Official Responses/Best Practices: Analyze exit rates in the context of user flow. For pages with unexpectedly high exit rates, investigate the preceding pages and the content on the exit page itself. Tools like user journey maps and session recordings can help pinpoint where users get stuck or confused before leaving.
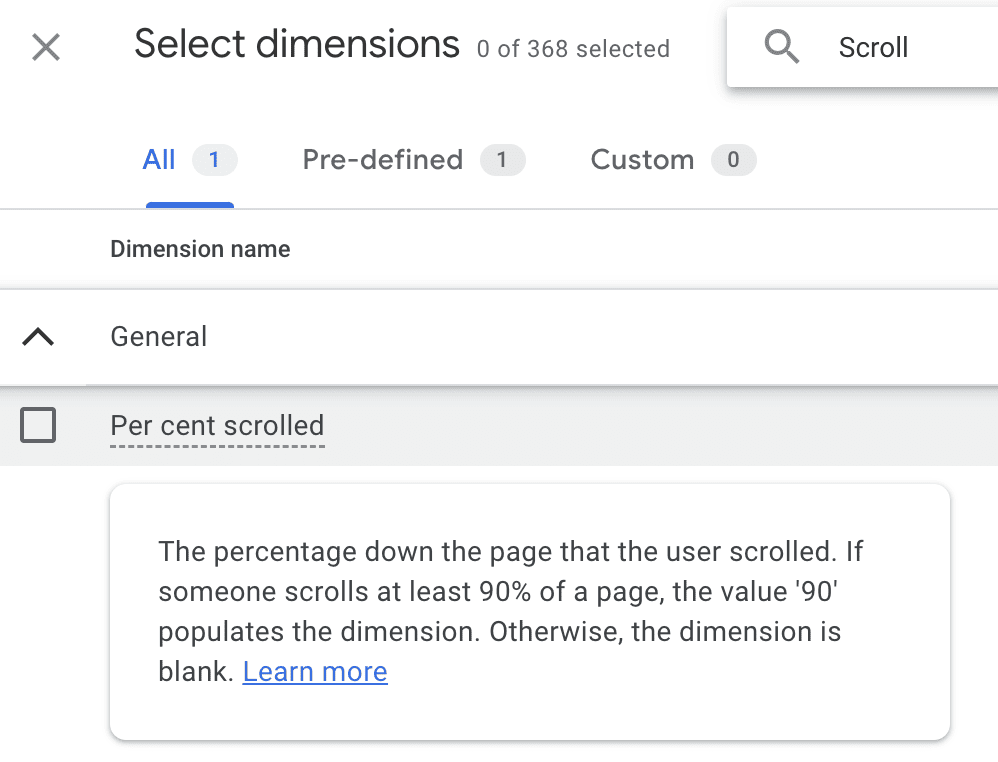
8. Scroll Depth: How Far Down Do They Go?
Main Facts: Scroll depth measures how far down a visitor scrolls on a landing page, typically expressed as a percentage (e.g., 25%, 50%, 75%, 100%). It primarily tracks vertical scrolling but can be adapted for horizontal elements like comparison tables.
Supporting Data: GA4 includes "Percent scrolled" as a dimension, which can be analyzed in explorations. This provides insights into content consumption patterns.
Implications: This engagement metric is particularly valuable for long-form landing pages or those with crucial elements placed lower down.
- Visibility of Key Information: If important calls-to-action (CTAs), security badges, social proof, or key product features are below 50% scroll depth, and your scroll depth data shows most users don’t reach that point, it indicates these elements are not being seen.
- Content Engagement: Low scroll depth on content-heavy pages suggests users are not finding the content compelling enough to continue reading, or the information they need is not immediately apparent.
Official Responses/Best Practices: Use scroll depth data to optimize content hierarchy and element placement. Ensure that critical information and primary CTAs are "above the fold" or within the initial scroll view. For longer pages, strategically place secondary CTAs or compelling snippets to encourage further scrolling. Complement scroll depth data with heatmaps (from tools like Hotjar or Clarity) to visually understand where users stop scrolling and what content they focus on.
9. Click-Through-Rate (CTR): The Path to Interaction
Main Facts: On a landing page, CTR measures the percentage of visitors who click on a specific interactive element, such as a button, internal link, or image.
Formula:
Total Clicks on Element / Total Impressions (or Views) of Element * 100
Example: If a CTA button was visible 2,340 times and received 147 clicks:
CTR = 147 / 2340 * 100 = 6.28%
Implications: CTR for internal elements is a direct indicator of their effectiveness.
- High CTR: Suggests that your copy, design, and call to action are compelling, relevant, and effectively encourage users to take the next step.
- Low CTR: Signals potential issues such as irrelevant button text, poor visual design, unconvincing micro-copy, or a lack of trust. A sudden dip might also point to technical problems, like a broken link or non-functional button.
Official Responses/Best Practices: Track CTR for all key interactive elements on your landing page. A/B test different button colors, sizes, placements, and especially the text used in your CTAs. Ensure the value proposition of clicking is clear and enticing. CTR is crucial for pages designed to guide users deeper into your website or to specific conversion funnels.
User Segmentation for Refined Strategies
Understanding your audience at a deeper level allows for more nuanced optimization.
10. New vs. Returning Visitors: Distinct Audiences, Distinct Needs
Main Facts: This metric segments your audience into two fundamental groups: new visitors (first-time users) and returning visitors (those who have previously visited your site). Both metrics are readily available in GA4.
Supporting Data: Analyzing other metrics (like conversion rate, bounce rate, average engagement time) for each of these segments independently provides powerful insights.
Implications: New and returning visitors often have different intents and expectations, requiring distinct approaches:
- New Visitors: Typically in the awareness or consideration phase, they are looking for foundational information and a clear understanding of your offering. A high bounce rate for new visitors could indicate a mismatch between their initial search/ad intent and the landing page’s content, or a failure to quickly communicate value. Strategies might focus on clear value propositions, strong trust signals, and easy-to-understand information.
- Returning Visitors: These users are likely further down the conversion funnel. They might be comparing options, seeking specific details, or ready to complete a purchase/action they previously started. Their bounce rate should ideally be lower, and their engagement higher, as they are more familiar with your brand. If returning visitors show high bounce rates or low conversions, it could signal issues with remembering previous interactions, a lack of updated information, or a frustrating user experience.
Official Responses/Best Practices: Segmenting your landing page performance by new vs. returning visitors allows for highly targeted optimization. Consider creating personalized experiences or retargeting campaigns for returning visitors, guiding them towards conversion. For new visitors, focus on clarity, immediate value, and building trust. Combining this data with qualitative analysis (heatmaps, session recordings) can reveal the "why" behind the "what," helping to understand their distinct behaviors and tailor your pages accordingly.
Summary: A Holistic Approach to Landing Page Excellence
This deep dive into the top 10 landing page metrics underscores their indispensable role in any effective digital marketing strategy. While some metrics are universally critical (like conversion rate), others gain prominence based on the specific goals of your landing page and the nuances of your industry.
The ultimate objective of any landing page is to facilitate a desired action, and these metrics provide the data-driven framework to assess its effectiveness. However, it’s crucial to remember that these numbers rarely tell the whole story in isolation. The most profound insights emerge when metrics are analyzed in combination, allowing for a holistic understanding of user behavior. For instance, a high bounce rate paired with a short average time on page for new visitors arriving from a paid search campaign paints a very different picture than a low bounce rate and long engagement time for returning visitors from an email campaign.
Perhaps the most potent "non-metric" is the traffic source. By segmenting all other metrics by their origin, you unlock the ability to pinpoint which channels deliver the most engaged and converting audiences, enabling precise budget allocation and campaign refinement.
To truly elevate landing page optimization, quantitative data from analytics tools like GA4 should be augmented with qualitative insights. Behavioral web analytics tools such as Hotjar or Clarity offer heatmaps and session recordings, providing a visual "why" to the "what" revealed by the numbers. Witnessing user struggles, confusion, or engagement patterns directly can inspire powerful, empathetic design and content changes. Further still, incorporating user testing, direct interviews, and exit-intent surveys can capture direct feedback on pain points and motivations, bridging the gap between data and human experience.
Improving user experience on landing pages is an iterative journey of continuous measurement, analysis, and refinement. By embracing these metrics and complementing them with qualitative research, marketers can transform their landing pages from mere digital brochures into high-performing conversion powerhouses.
What metrics do you prioritize for your landing pages, and how do they inform your optimization strategies? Share your insights in the comments below!
