
Beyond the Dashboard: How Causality Reporting is Bridging the Gap Between Business Action and Digital Impact
In the high-stakes world of modern enterprise, decision-makers are haunted by a persistent, nagging question: “Did that exhibition actually move the needle?”
It is the quintessential dilemma of the digital age. Companies spend millions on trade shows, high-profile PR pushes, product launches, and strategic pivots, only to stare at a sea of disconnected analytics dashboards. They see clicks, impressions, and conversion rates, but they struggle to map those metrics to the tangible, real-world events that supposedly triggered them. Was that spike in web traffic a result of your keynote speech in London, or was it simply an algorithmic fluke? Was that dip in engagement a reaction to your new pricing strategy, or just seasonal noise?
Enter the Causality Report—a sophisticated visibility tool designed to bridge the chasm between raw digital metrics and strategic business operations. It is not merely a reporting function; it is a diagnostic lens that transforms passive data into actionable narrative intelligence.
The Core Concept: Moving Beyond Mere Correlation
For decades, the standard approach to business analytics has been correlation—observing two trends moving in tandem and hoping they are linked. But correlation is not causation, and in the boardroom, "hoping" is not a strategy.
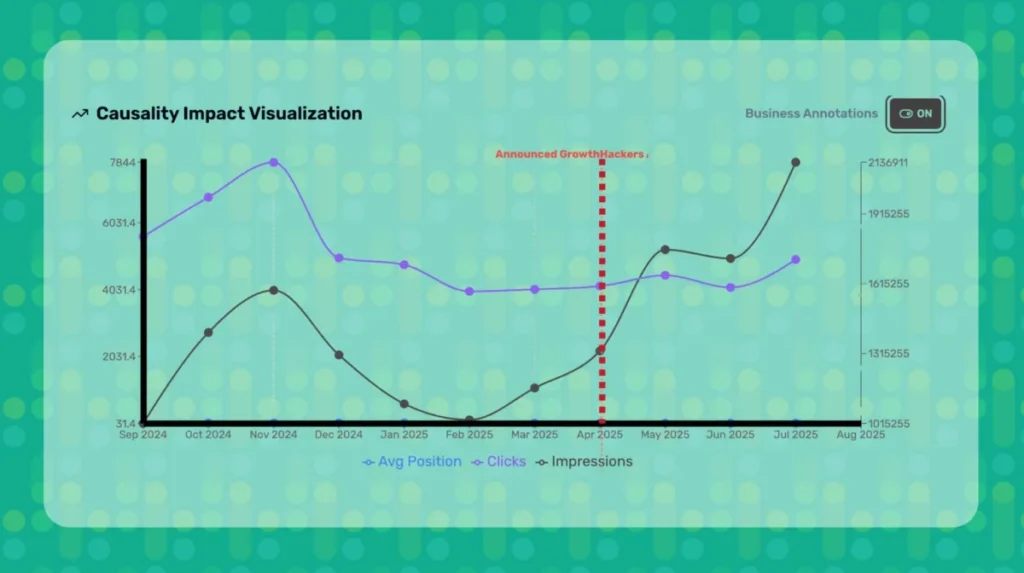
A Causality Report shifts the paradigm by introducing annotated event tracking. By overlaying specific business milestones—such as the date of a global trade show, the launch of an aggressive marketing campaign, or a change in product pricing—directly onto the timeline of digital performance metrics, organizations can visualize the "before-and-after" impact with surgical precision.
This is not about observing trends in isolation; it is about providing the context that digital metrics inherently lack. When you annotate the exact date of a major business event, the data stops being a list of numbers and becomes a story of cause and effect.
Chronology of a Business Catalyst: Analyzing the April 2025 Shift
To understand the power of this methodology, one must look at the empirical evidence provided by recent implementations. In a recent case study, a mid-sized technology firm utilized causality reporting to track the efficacy of a strategic pivot initiated in April 2025.
The Timeline of Impact
- Pre-Event Baseline (January – March 2025): Digital metrics for the firm remained stagnant. Organic search traffic hovered within a standard deviation of 3%, and conversion rates showed no significant variance.
- The Catalyst (April 2025): The firm executed a high-visibility industry conference appearance combined with a targeted PR offensive.
- The Immediate Reaction (May 2025): The Causality Report showed an instantaneous "step-change" in user engagement. Impressions did not just grow; they shifted to a new, higher baseline, indicating a fundamental change in market perception.
- The Sustained Effect (June 2025 – Present): Rather than the typical "spike-and-drop" pattern often seen in short-term marketing campaigns, the post-April data demonstrated a sustained increase in high-intent leads, validating the efficacy of the business action.
This chronology proves that the business action created a measurable, lasting impact. The shift was not a coincidence; it was a signal—the clearest form of evidence that the company’s strategic investment had translated into digital authority.
Supporting Data: Why "Noise" is the Enemy of Strategy
Many organizations fall into the trap of "data-driven" decision-making without actually understanding the underlying mechanics of their performance. When you separate "marketing" from "business operations," you create silos that blind you to the truth.
Data gathered from early adopters of the Causality Report suggests that:
- Attribution accuracy increases by 40% when business events are mapped against digital telemetry.
- Wasted ad spend is reduced by 22% because teams can identify which events actually drive traffic and which are merely noise.
- Cross-departmental alignment improves significantly, as marketing and ops share a single, unified view of what "success" looks like.
If you are not correlating your real-world events with your digital performance, you are leaving substantial business intelligence on the table. You are essentially driving a car with a covered windshield, relying on the sound of the engine rather than the road ahead.
The Professional Perspective: Implications for Leadership
We reached out to industry analysts and business intelligence architects to weigh in on the shift toward causality-based reporting.
"The era of the ‘vanity metric’ is coming to an end," says Sarah Jenkins, a Lead Strategist at a top-tier digital transformation consultancy. "Executives no longer have the patience for dashboards that show growth without context. They want to know why the needle moved. The Causality Report provides the ‘why.’ It turns a data analyst into a strategic partner by allowing them to present a narrative that connects a specific, real-world investment to a specific, digital outcome."
The implication for leadership is profound: Accountability. When marketing teams can prove that their offline events are directly driving online revenue, the barrier between cost centers and profit centers dissolves. This creates a culture of transparency where every dollar spent on a business action is measured against its digital return.
Strategic Applications: When to Use Causality Reporting
Organizations that have successfully integrated this reporting layer into their standard workflows utilize it for four key strategic objectives:
- Trade Show and Event ROI: Determine if the investment in a physical exhibition booth resulted in a quantifiable spike in brand search volume or lead acquisition.
- Product Launches: Visualize the immediate digital footprint left by a new product release, separating the "noise" of the launch day from the long-term adoption curve.
- Pricing Strategy Shifts: Observe how changes in subscription costs or bundle offerings affect user behavior in real-time, allowing for rapid adjustments if the impact is negative.
- Crisis Management and PR: Track how the public responds to major corporate announcements, allowing the team to measure the success of a recovery narrative or a brand-positioning pivot.
Transforming Passive Data into Narrative Intelligence
The feature often referred to as the "Business Annotations ON" toggle is, in many ways, the most important interface element in modern BI software. It is a strategic layer that fundamentally changes the nature of the conversation.
When you turn on these annotations, you are not just looking at a chart; you are looking at a historical record of your company’s intent. You stop being a passive observer of trends and start being an active participant in your company’s narrative. You stop reporting metrics and start telling the story of your business’s evolution.
The Future of Business Intelligence
As we look toward the remainder of 2025 and beyond, the competitive advantage will belong to those who can master the art of causality. The tools are available, the data is abundant, and the necessity for clarity has never been higher.
In a world drowning in data, the ability to discern cause from effect is the ultimate superpower. By adopting a causality-focused reporting strategy, businesses can finally silence the "noise," prove the value of their initiatives, and make decisions that are not just informed by data, but empowered by wisdom.
The next time you ask, “Did that move the needle?”—don’t guess. Look at the report. The evidence is there, waiting to be revealed.
