
Unlocking Digital Attribution: The Imperative of UTM Parameters in Google Analytics 4
Last Modified on February 17, 2025

In the complex ecosystem of modern digital marketing, understanding the precise origins of website traffic is not merely advantageous, but absolutely essential for strategic decision-making and optimizing return on investment. At the heart of this analytical clarity lie UTM parameters – small, appended codes to URLs that act as digital breadcrumbs, meticulously guiding marketers through the labyrinth of online user journeys. With the industry’s significant migration to Google Analytics 4 (GA4), the strategic deployment and astute analysis of these parameters have become more critical than ever, offering a detailed blueprint of campaign performance that standard analytics alone cannot provide.

While numerous resources guide the creation of UTM parameters for incoming links, a significant challenge often emerges for digital professionals: effectively locating and interpreting this invaluable data within their GA4 accounts. This article delves into the indispensable role of UTM parameters, explores the methodologies for their analysis within GA4’s reporting infrastructure, and highlights advanced strategies and troubleshooting insights crucial for any data-driven organization.
The Digital Compass: What are UTM Parameters?
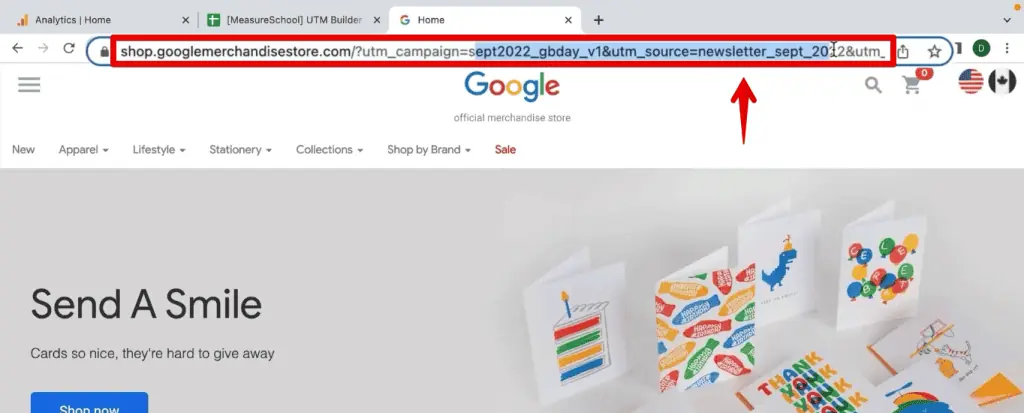
You have undoubtedly encountered these distinctive strings of text appended to web addresses, often appearing as a series of key-value pairs following a question mark in a URL, such as: https://example.com/?utm_source=newsletter&utm_medium=email&utm_campaign=sept_promo. These are UTM parameters – Urchin Tracking Module parameters – and they are the cornerstone of robust campaign tracking.
In essence, UTM parameters are small snippets of code added to URLs. Their primary function is to enable precise identification of the source, medium, and campaign that drive traffic to specific web pages. This granular level of detail allows marketers to move beyond generic traffic numbers, providing a clear understanding of the "who," "how," and "what" behind user engagement with online content. While their use is not recommended for internal website linking, they are profoundly beneficial for external links directing users to a website, transforming raw traffic data into actionable intelligence.
The Evolving Landscape of Digital Attribution: A Chronology
The journey of digital analytics has seen significant shifts, with Google Analytics 4 representing a monumental leap from its predecessor, Universal Analytics (UA). This transition underscores a broader industry move towards event-driven data models and a heightened focus on user privacy. Within this evolving framework, the significance of UTM parameters has not diminished; rather, it has become even more pronounced.

Historically, UA provided valuable insights, but its session-based model often presented challenges in tracking complex cross-platform user journeys. GA4, with its event-centric approach, aims to unify user behavior across different devices and touchpoints. This modern paradigm demands equally sophisticated attribution mechanisms. UTM parameters offer a stable, first-party data solution that complements GA4’s capabilities, ensuring that even as third-party cookies face obsolescence, marketers retain the ability to accurately attribute traffic to their specific marketing efforts.
The chronology of traffic tracking can be seen as a progression from basic referral data to sophisticated, campaign-specific insights. UTMs emerged as a vital tool to bridge the gap between aggregated traffic statistics and the nuanced performance of individual marketing initiatives. Their consistent application allows for a chronological understanding of campaign effectiveness, enabling marketers to trace the performance of promotional activities over time, from initial launch to subsequent optimizations.
Unlocking Deeper Insights: The Power of Granular Data
The utility of UTM parameters extends far beyond mere traffic counting; they are instrumental in uncovering the true narrative embedded within analytics figures. Consider a hypothetical scenario: a marketing team launches a multi-channel campaign promoting a new product across Facebook, LinkedIn, and Google Ads. Without UTM tagging, the analytics report might simply show 1,000 visitors and 100 purchases to the product page. This aggregated data offers limited scope for performance evaluation.

With the strategic application of UTM codes, however, the picture gains immediate clarity. The team can ascertain that, for example:

- Facebook ads generated 400 visits, resulting in 60 purchases, indicating a strong performance.
- LinkedIn outreach contributed 300 visits, but only 20 purchases, suggesting a need for content or targeting refinement.
- Google Ads drove 300 visits and 20 purchases, highlighting specific keyword or ad copy underperformance.
This level of detailed attribution is critical. It allows marketing managers to analyze campaign performance with precision, identify high-performing channels and content, and reallocate budgets effectively to maximize return on investment. It empowers data-driven decisions, transforming generic traffic numbers into a strategic asset.
UTM parameters find broad application across various digital platforms and tools, including:
- Social Media Campaigns: Tracking engagement from posts, ads, and influencer collaborations.
- Email Marketing: Monitoring clicks and conversions from newsletters and promotional emails.
- Paid Advertising: Differentiating performance across various ad platforms and specific ad creatives.
- Affiliate Marketing: Attributing traffic and conversions to specific affiliate partners.
- Content Syndication: Understanding the reach and impact of distributed articles or whitepapers.
- Offline Campaigns with QR Codes: Bridging physical marketing to online analytics.
Essentially, any shared link designed to direct users to a website can be enhanced with UTM parameters, ensuring comprehensive data capture.
Navigating the Google Analytics 4 Interface: Official Approaches to UTM Analysis
Once UTM parameters are meticulously embedded in URLs, the subsequent challenge lies in effectively accessing and interpreting this data within Google Analytics 4. GA4 offers two primary pathways for viewing UTM parameters: the standard reporting interface and the more flexible Exploration Reports. Both methods are sanctioned approaches by Google and serve distinct analytical needs.
Standard Reports: Initial Overview
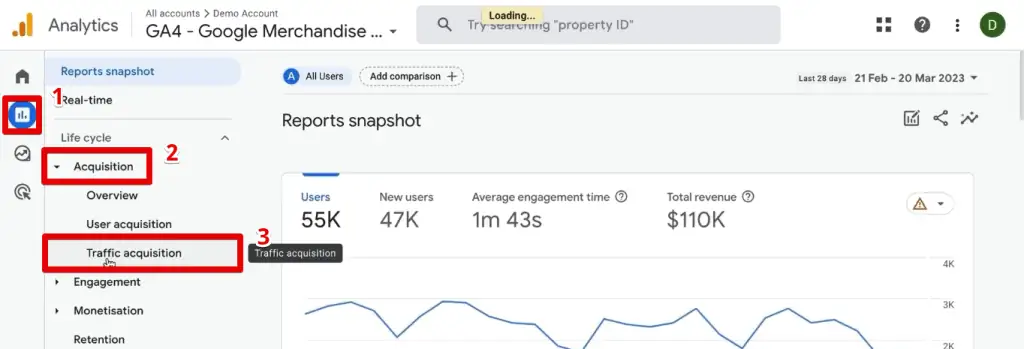
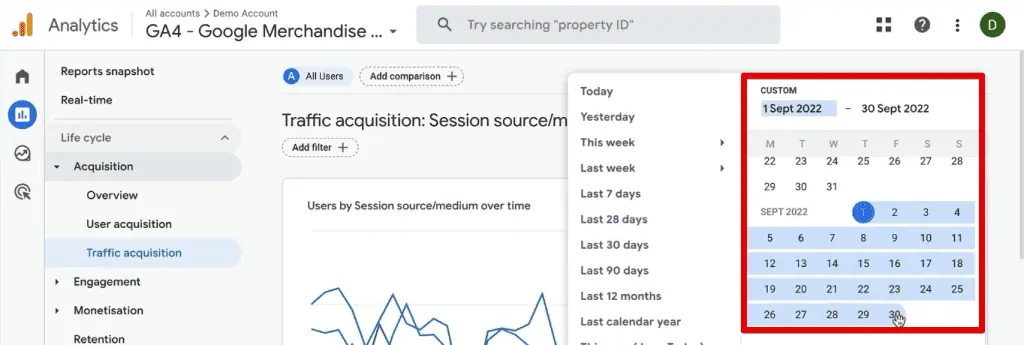
For a quick overview of campaign performance, marketers often turn to GA4’s standard reports. The primary destination for campaign traffic analysis is the Traffic Acquisition report.
To access this:
- Navigate to Reports in the left-hand menu.
- Select Acquisition, then Traffic Acquisition.
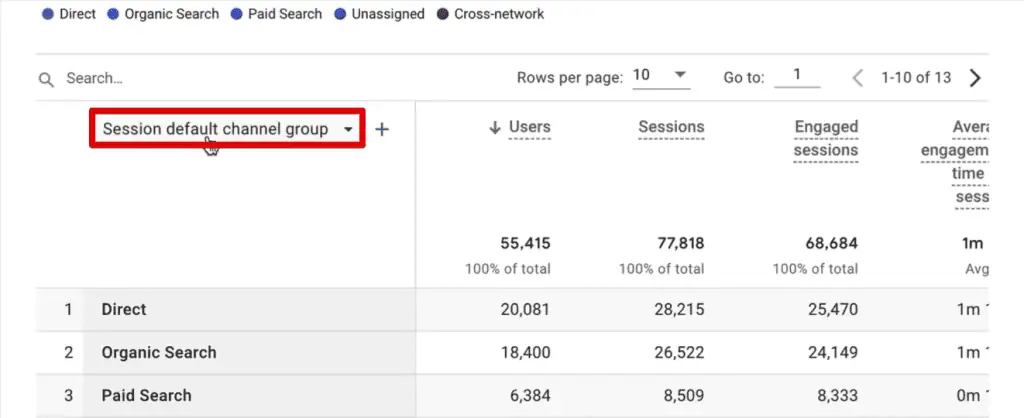
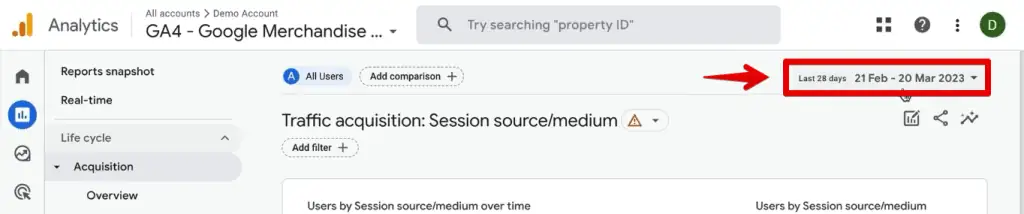
Upon entering this report, the data is initially presented with the "Session default channel grouping" as the primary dimension. To pivot this view towards UTM-specific data, the primary dimension must be adjusted. By clicking on the "Session default channel group" header, analysts can select "Session source/medium." This dimension provides a combined view of the origin and method of traffic, directly reflecting the utm_source and utm_medium parameters.
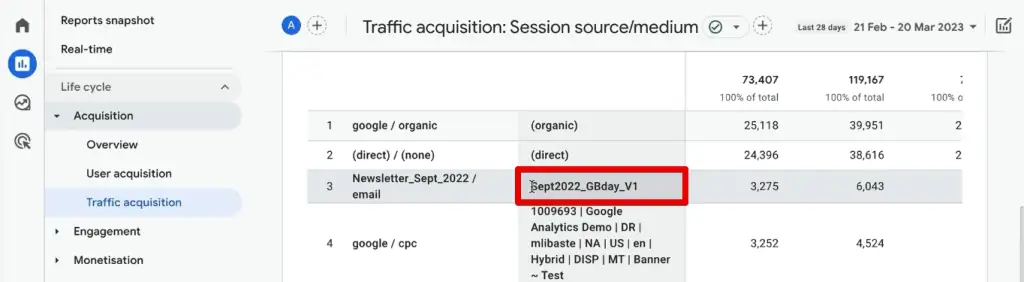
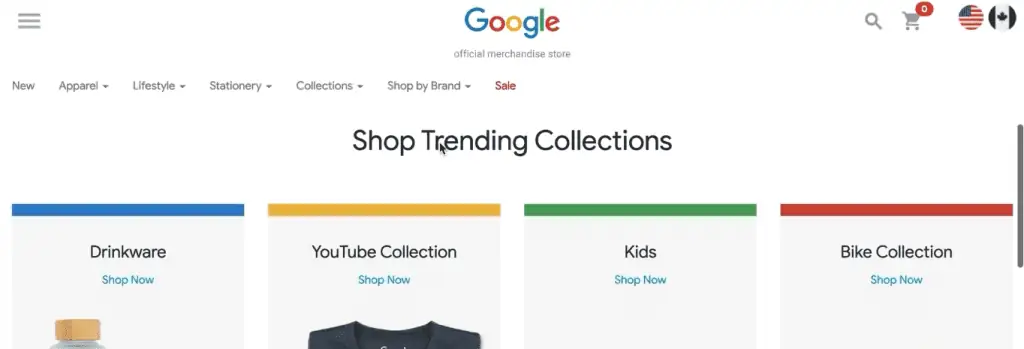
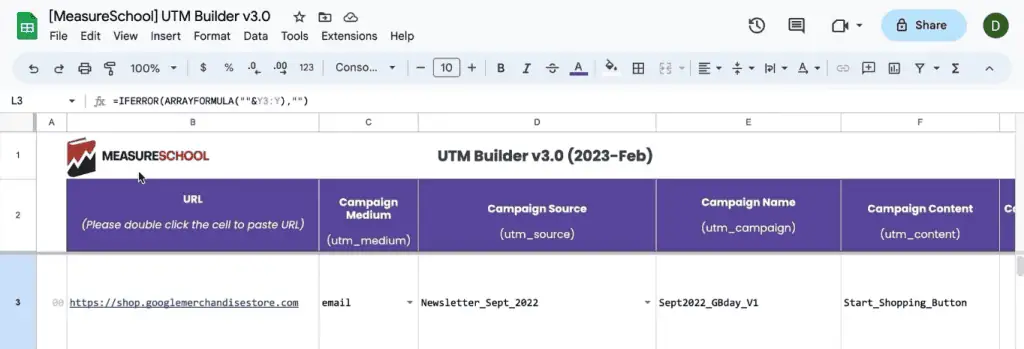
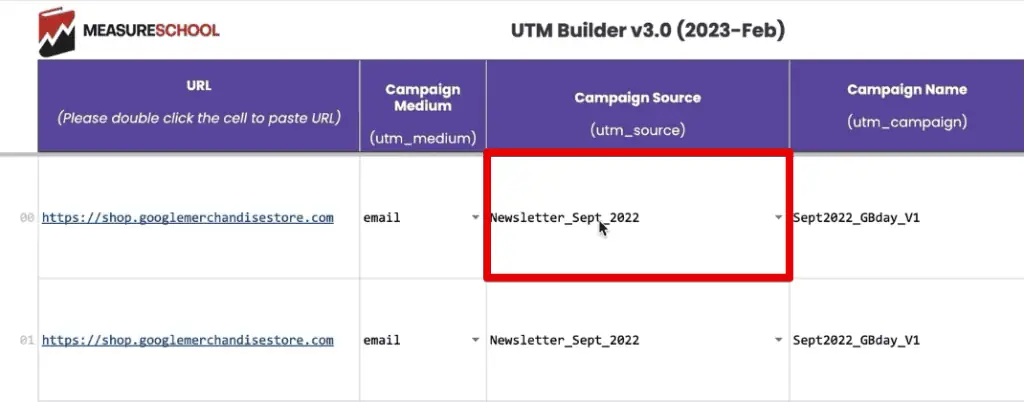
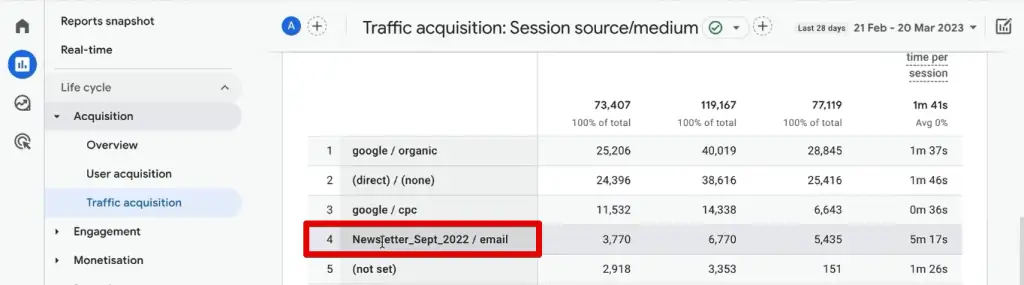
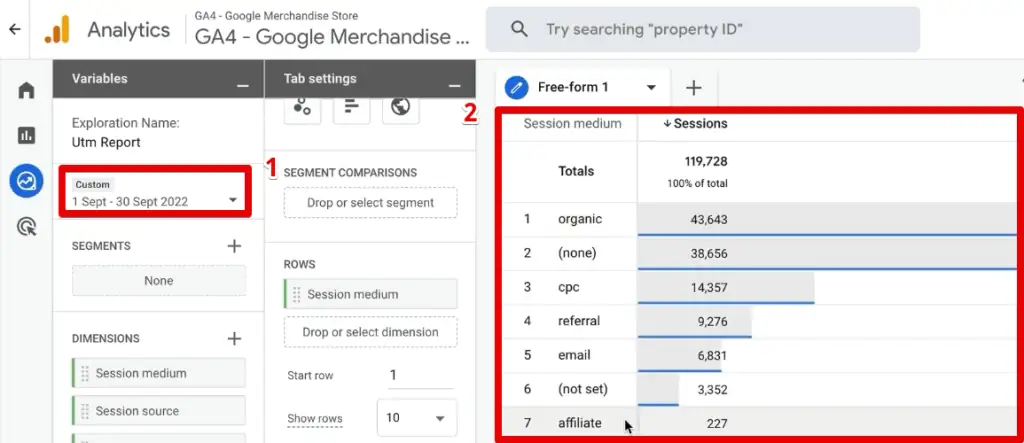
Consider an illustrative case using the Google Merchandise Store, where newsletter links are consistently tagged with UTMs. To identify traffic from a "Newsletter_Sept_2022" source, for instance, an analyst would first adjust the date range to September 2022. The report would then clearly display the "Newsletter_Sept_2022 / email" entry, indicating sessions driven by that specific campaign.
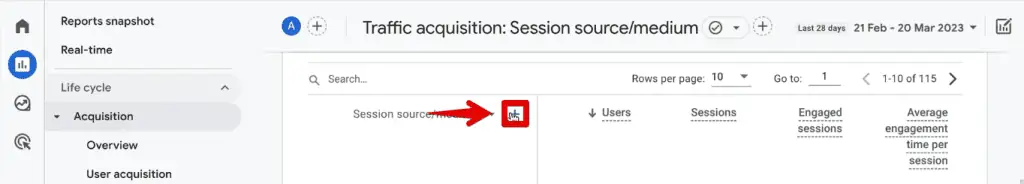
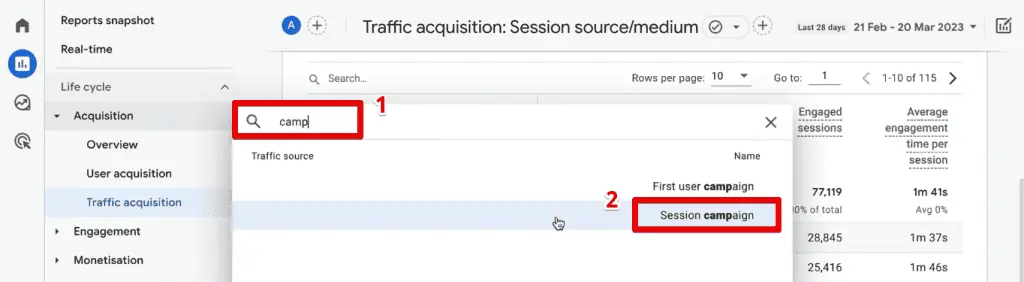
While the standard report primarily displays source and medium, additional UTM parameters can be introduced as secondary dimensions. By clicking the ‘+’ icon, an analyst can search for and add dimensions like "Session campaign" (corresponding to utm_campaign). This reveals the campaign name associated with the newsletter source, providing a deeper layer of insight within the standard reporting framework. However, it’s important to note that standard reports typically limit the number of visible dimensions, which can constrain complex multi-parameter analyses.
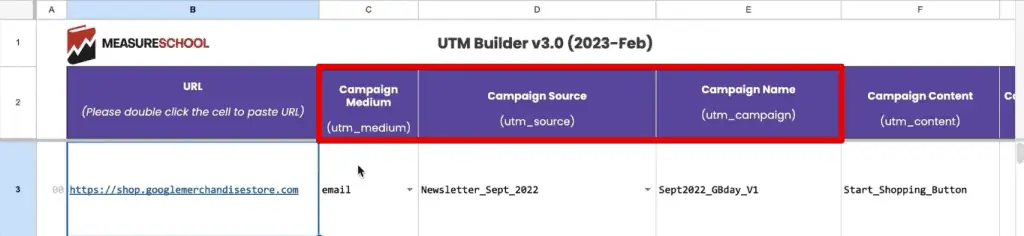
For a comprehensive understanding of all GA4 UTM parameters and their corresponding dimensions, Google’s official documentation on GA4 URL builders serves as the definitive reference. Crucially, the parameters utm_source, utm_medium, and utm_campaign are always recommended for consistent and meaningful tracking. Optional parameters such as utm_content, utm_term, utm_id, and utm_source_platform offer further granularity, although utm_creative_format and utm_marketing_tactic are not currently reported in GA4 properties.

Advanced Exploration: Crafting Bespoke Attribution Models
For more intricate analyses and the ability to combine multiple UTM parameters, GA4’s Exploration Reports are the preferred tool for seasoned analysts. These custom reports offer unparalleled flexibility in data visualization and segmentation.
To initiate a custom exploration:
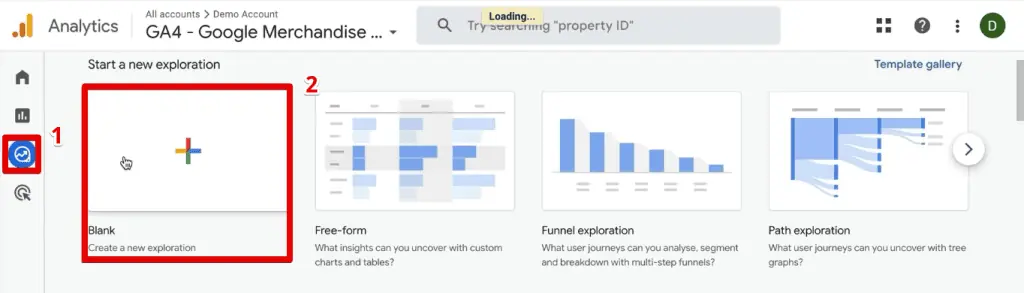
- Navigate to Explore in the left-hand menu.
- Select Blank to start a new report.
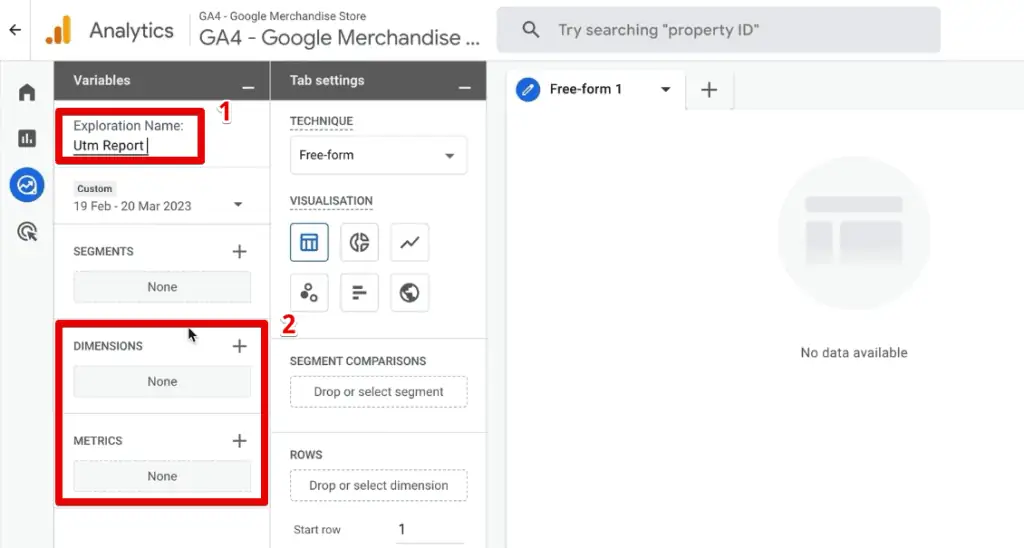
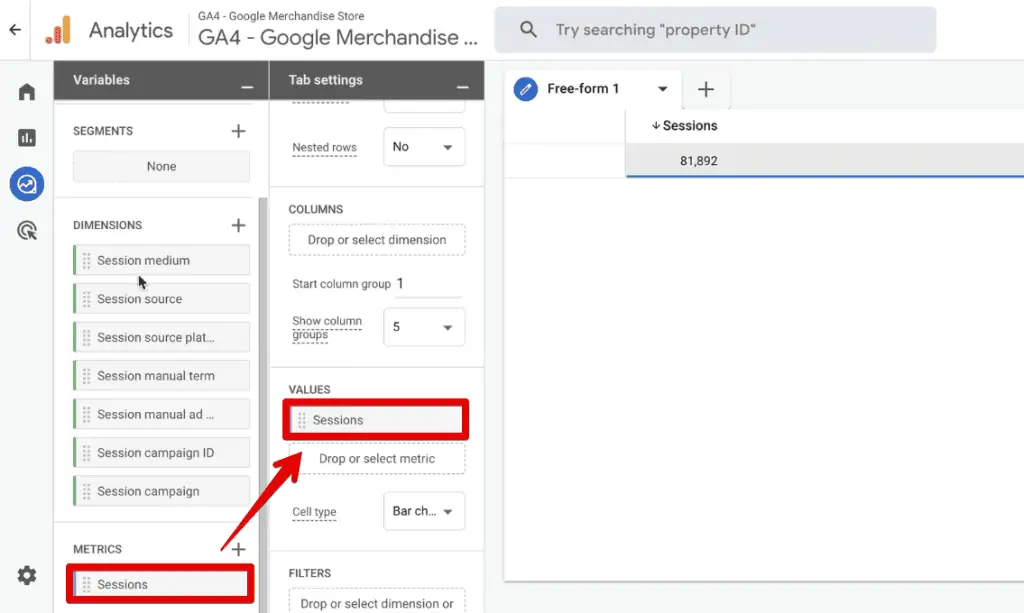
The initial step involves naming the exploration report and then populating the Dimensions and Metrics sections with the relevant data points. For metrics, "Sessions" is a fundamental choice to understand traffic volume.
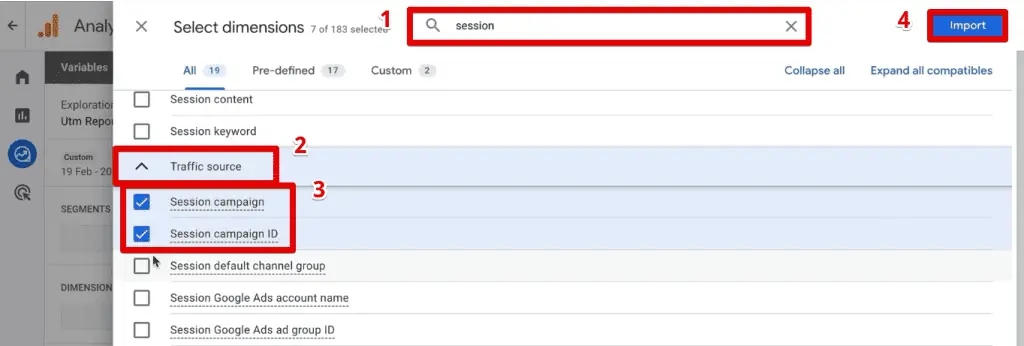
The key to leveraging Exploration Reports for UTM analysis lies in understanding the mapping between UTM parameters and their GA4 dimension counterparts. While some are intuitively named (e.g., utm_source maps to "Session source"), others require specific knowledge:
| UTM Parameter | GA4 Dimension |
|---|---|
utm_id |
Session campaign ID |
utm_source |
Session source |
utm_medium |
Session medium |
utm_campaign |
Session campaign |
utm_source_platform |
Session source platform |
utm_term |
Session manual term |
utm_content |
Session manual ad content |
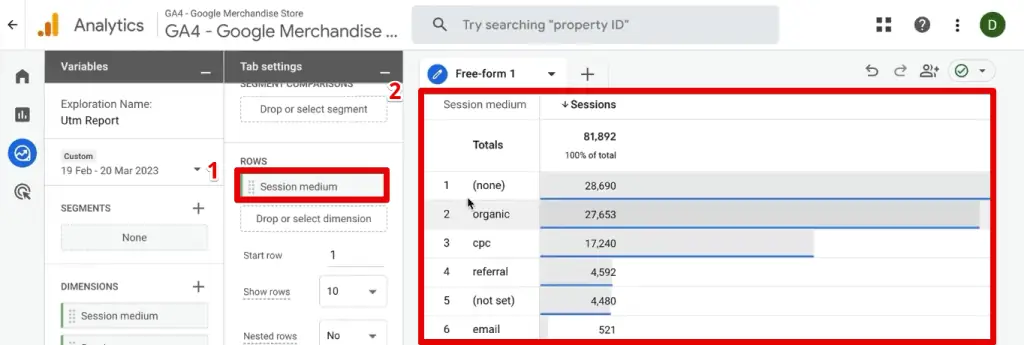
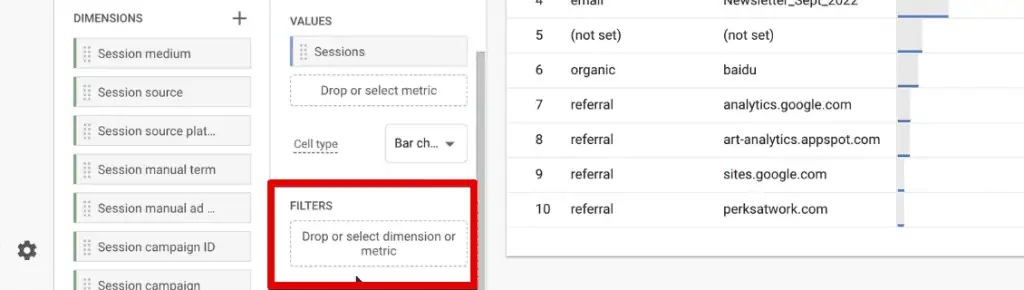
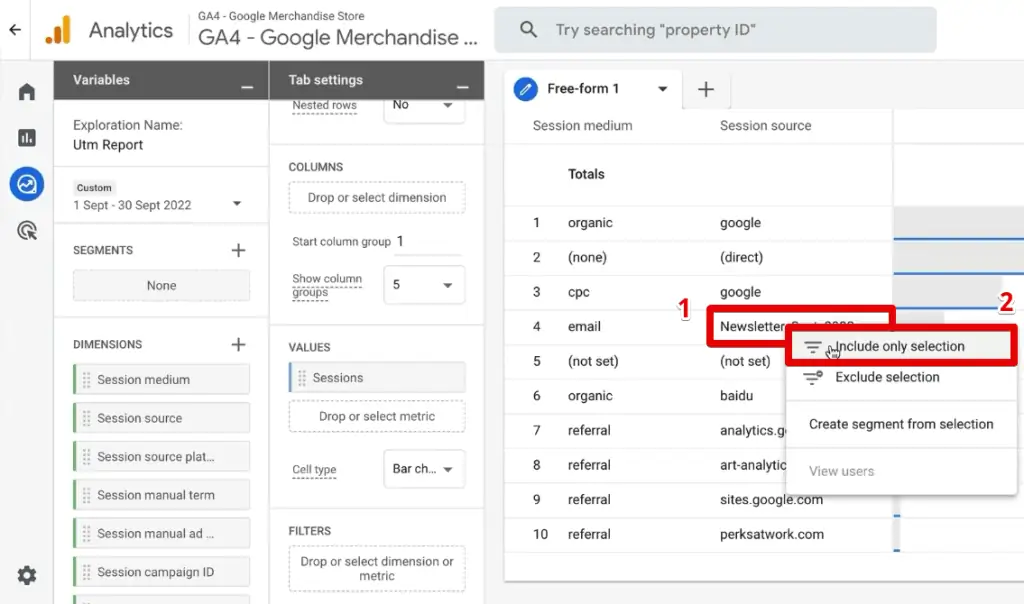
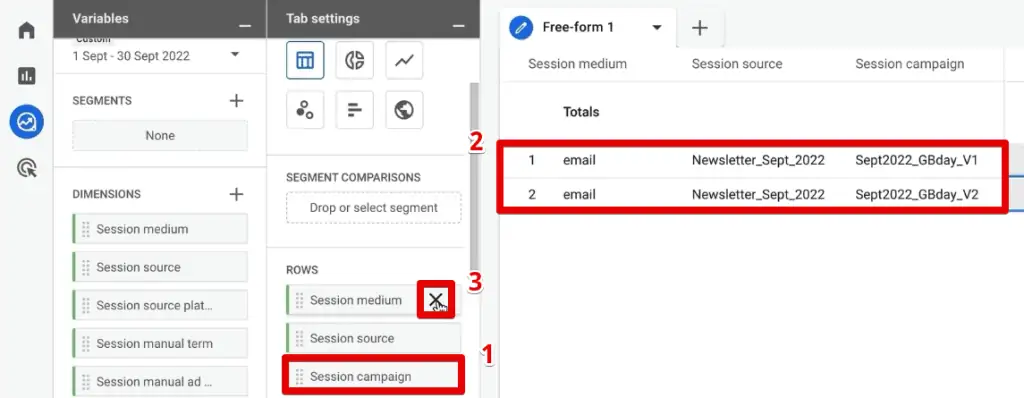
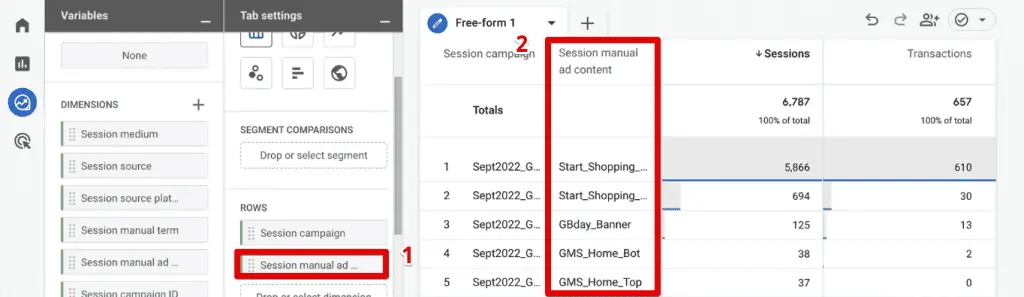
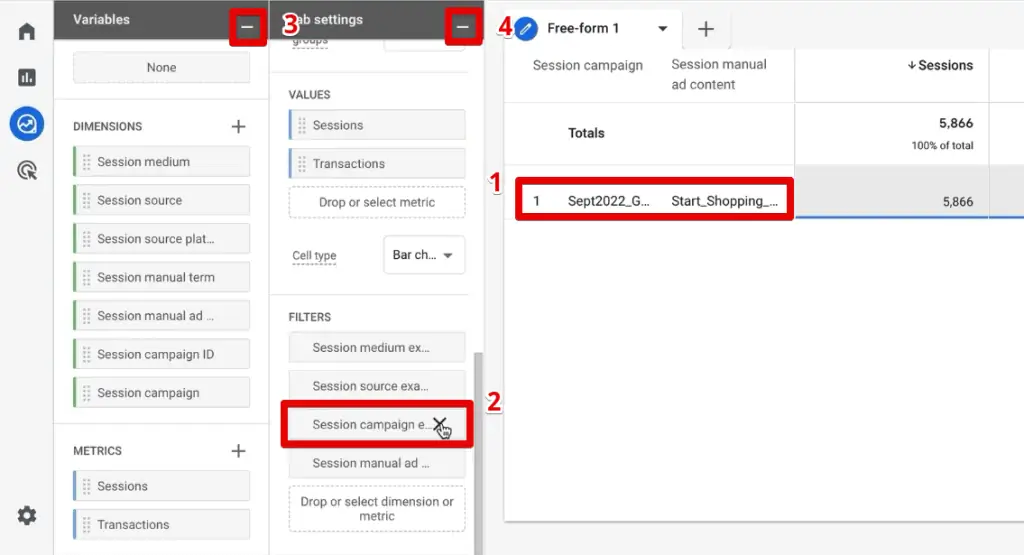
By importing these dimensions and the "Sessions" metric, analysts can begin constructing their custom report. Dragging "Sessions" to the "Values" section populates the report with basic traffic data. Subsequently, adding dimensions like "Session medium" and "Session source" to the "Rows" section builds a foundational table.
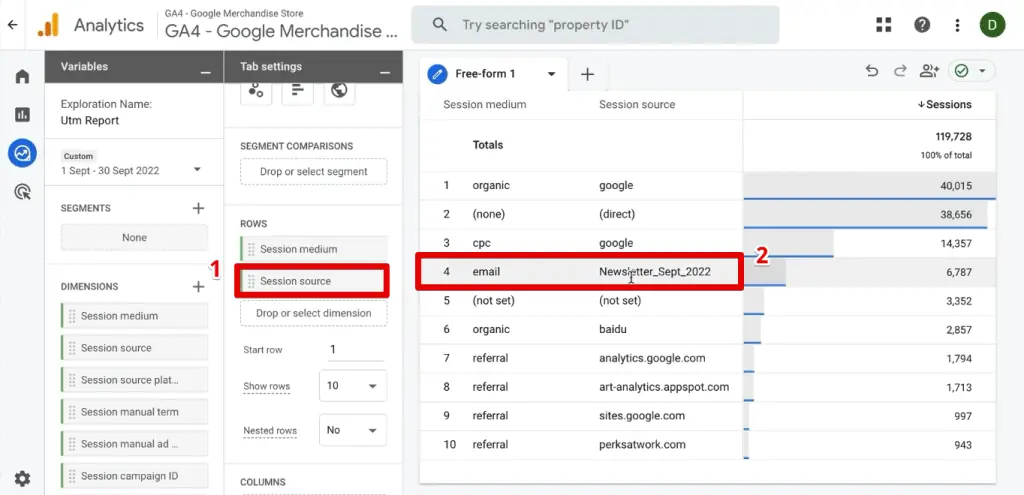
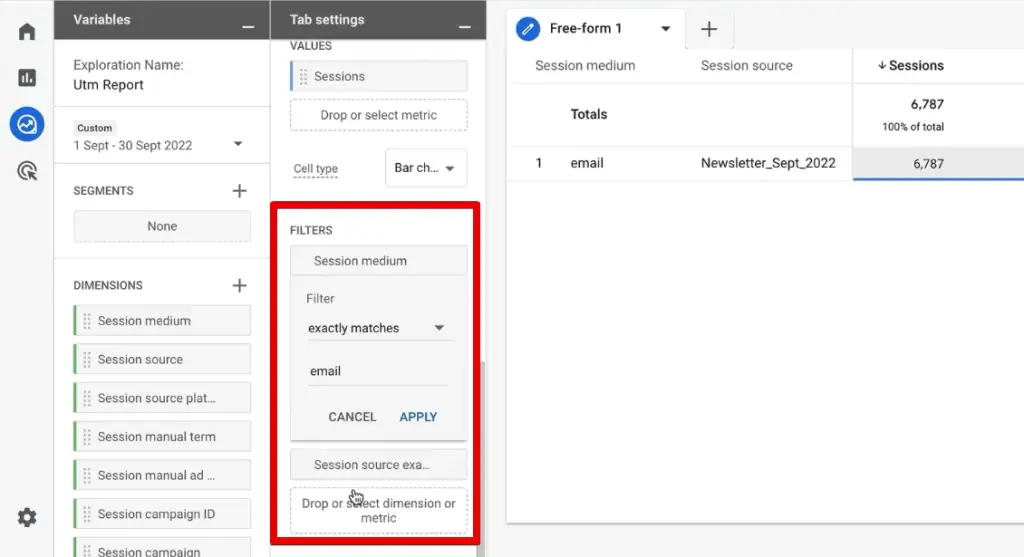
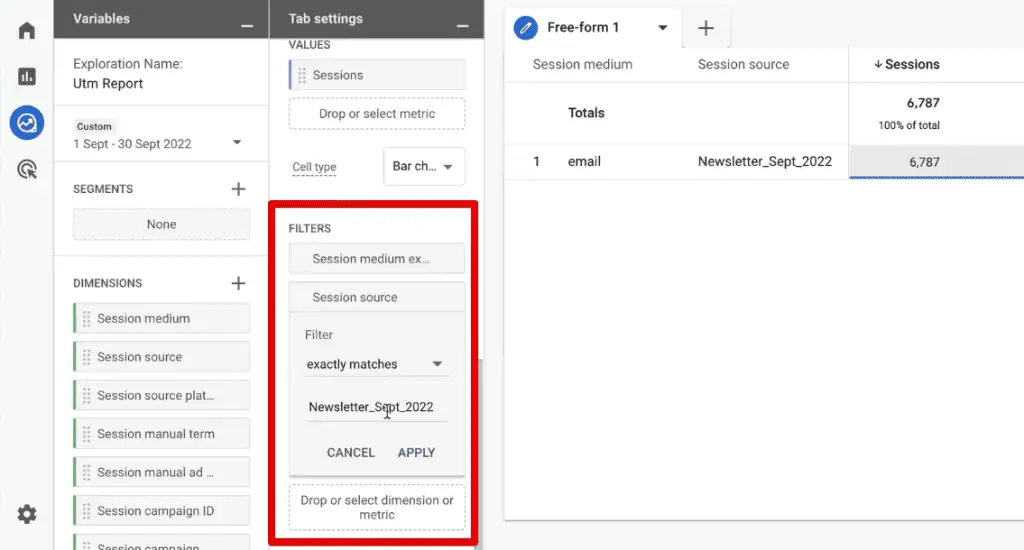
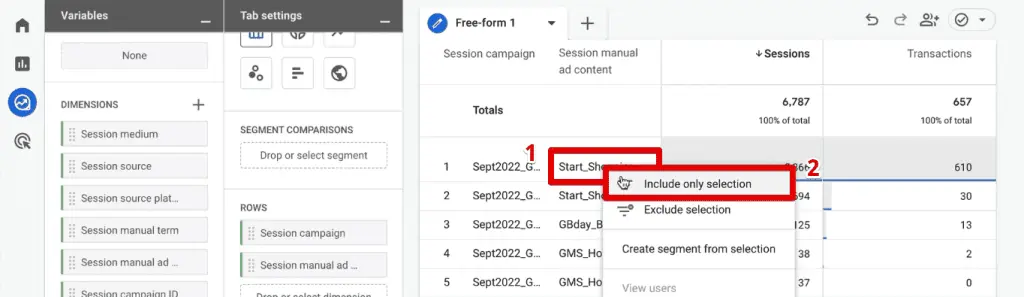
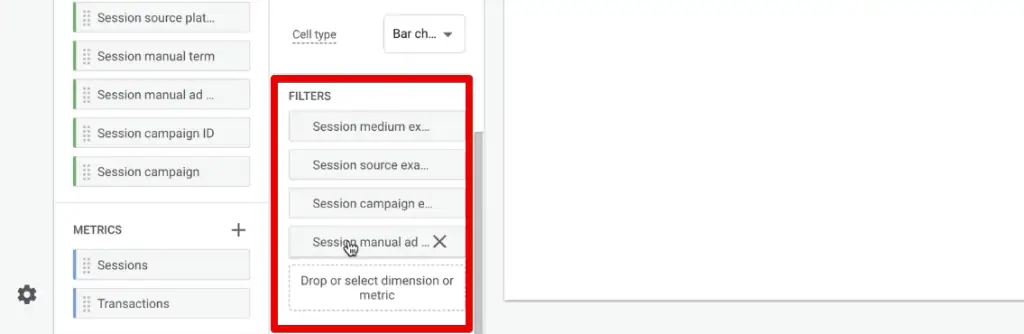
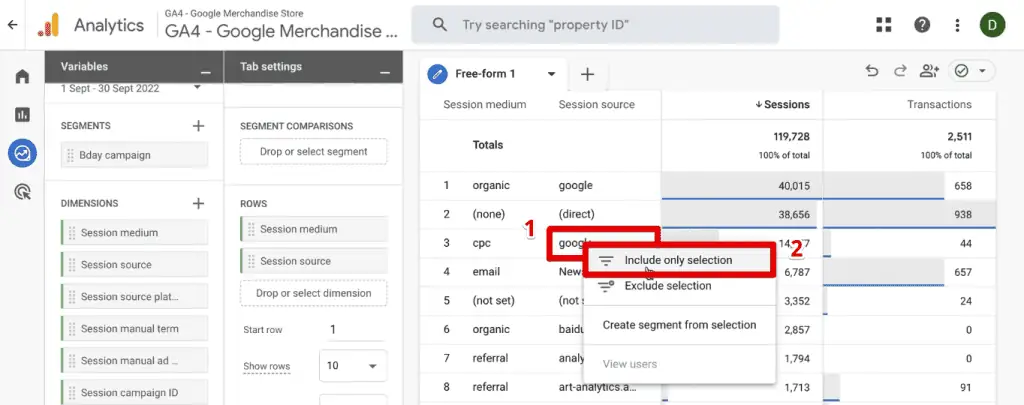
A powerful feature of Exploration Reports is the ability to apply filters directly from the data table. By right-clicking a specific data point (e.g., "Newsletter_Sept_2022" under "Session source") and selecting "Include Only Selection," GA4 automatically generates the necessary filters in the "Filters" section. This streamlines the process of isolating specific campaign data.
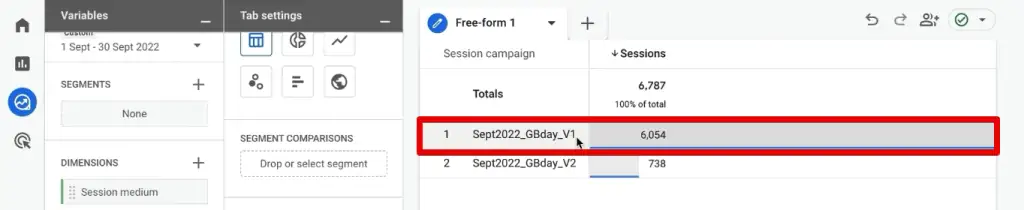
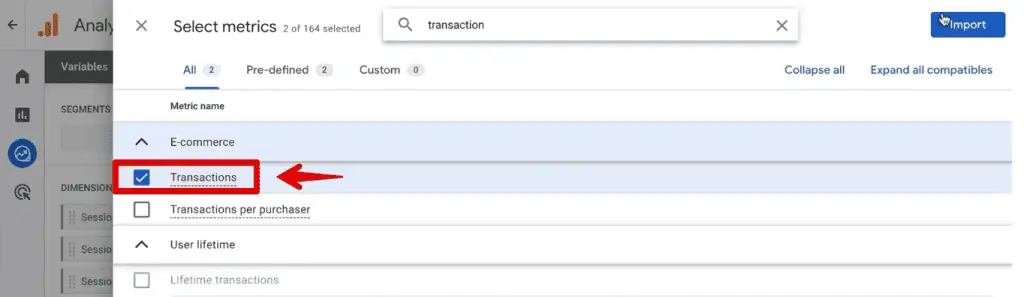
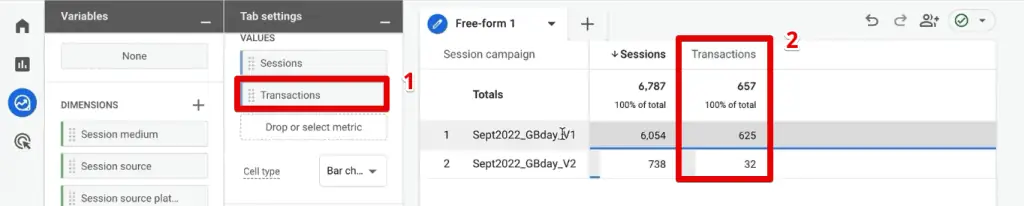
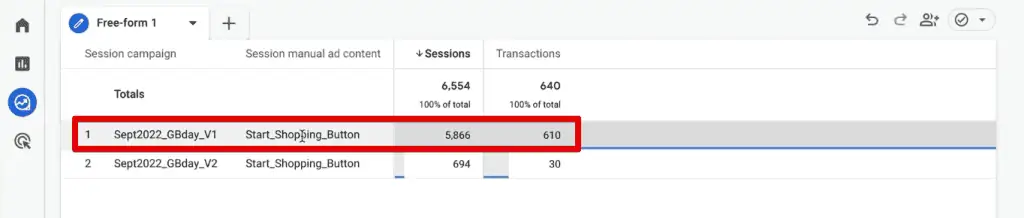
Once filtered, an analyst can then replace "Session medium" and "Session source" in the "Rows" with other dimensions like "Session campaign." This allows for a focused analysis, for example, comparing different campaign versions within a specific newsletter. If the newsletter had "Birthday Campaign" and "Newsletter_Version_1" campaigns, the report would clearly show which campaign generated more sessions and, crucially, more "Transactions" (an additional metric that can be easily added for e-commerce sites). This reveals concrete insights, such as "Newsletter_Version_1" outperforming "Birthday Campaign" in terms of both traffic and conversions.
Comparing Different Versions of UTM Content Through Segments
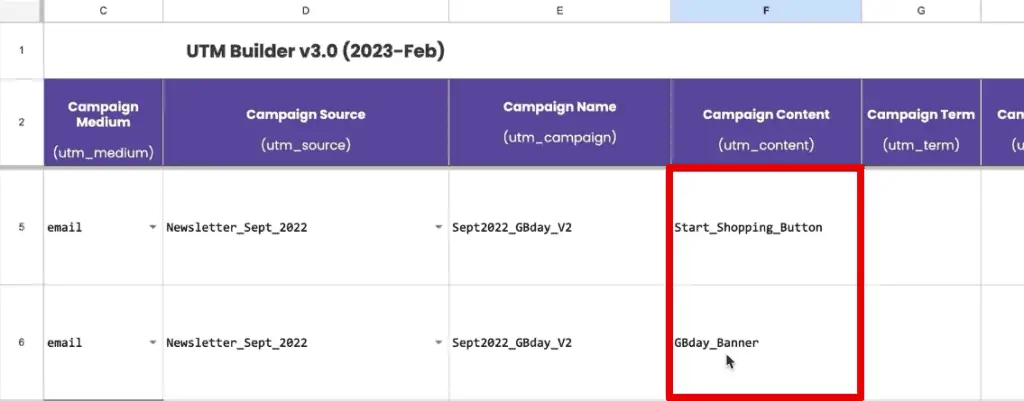
Exploration Reports further empower comparative analysis through the creation of segments. If an analyst wishes to compare the performance of distinct elements within a campaign (e.g., a "Start Shopping Button" vs. a "Birthday Banner" (utm_content)), segments provide the necessary framework.
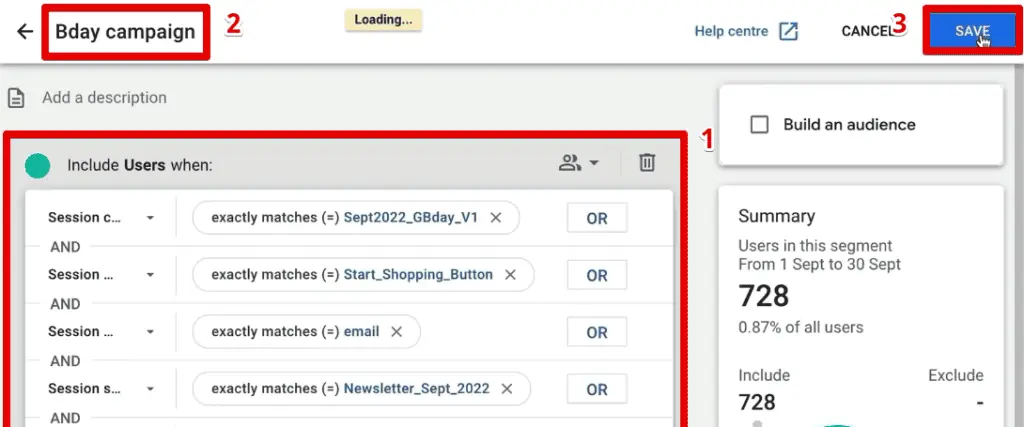
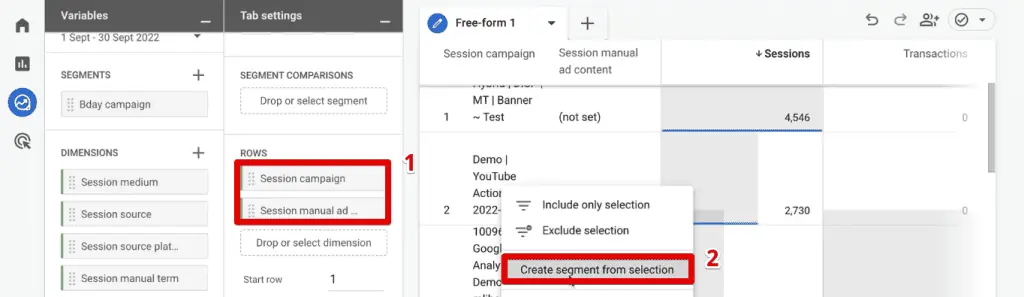
By applying filters to isolate a specific content element (e.g., "Session manual ad content" containing "Start_Shopping_Button") and then right-clicking that data point to "Create Segment from Selection," GA4 rapidly constructs a reusable segment based on those criteria. This segment encapsulates all the applied filters (source, medium, campaign, content).
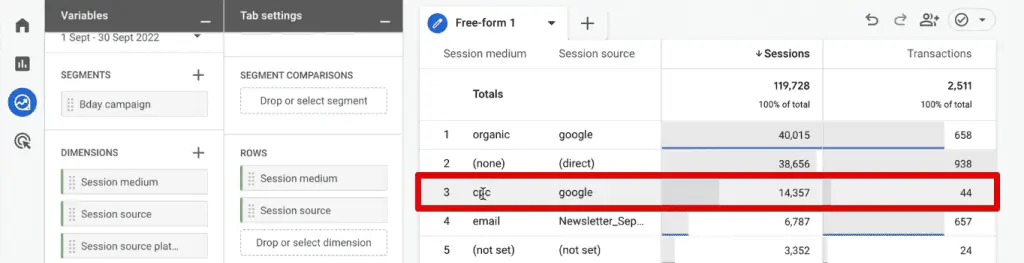
Once multiple segments are created (e.g., one for "Start_Shopping_Button_V1" and another for "Start_Shopping_Button_V2"), they can be dragged into the "Segment Comparisons" section of the report. This presents the data side-by-side, along with a "Totals" column, enabling direct comparison of performance across different content variations, campaign iterations, or any other segmented user group. This powerful capability allows for A/B testing analysis and deep dives into which creative elements resonate most effectively with audiences. The flexibility extends to various visualizations, including time-series graphs, to observe trends over time.
Beyond GA4: Integrating UTM Data into the Ecosystem
The strategic use of UTM parameters extends beyond GA4’s native reporting, playing a pivotal role in broader marketing technology stacks and advanced analytics strategies.
Custom UTM Parameters
When standard UTM parameters (source, medium, campaign, etc.) do not fully capture the specific nuances of a marketing initiative, custom UTM parameters become indispensable. By setting these as custom dimensions within GA4, marketers can track highly specific attributes relevant to their unique campaigns. This typically involves using Google Tag Manager (GTM) to capture the value of a custom query parameter from the URL and then sending it to GA4 as a custom event parameter, which is then registered as a custom dimension. This ensures that unique identifiers, specific sub-campaigns, or granular content variations are accurately reported and analyzable.
Passing UTM Parameters to CRM Tools
For businesses with robust sales funnels and Customer Relationship Management (CRM) systems, preserving UTM parameters beyond the initial website visit is crucial for full-funnel attribution. If a user clicks a UTM-tagged link, browses several pages, and then fills out a lead form, the initial UTM data might be lost without specific mechanisms.
This is commonly achieved by storing UTM data in first-party cookies upon a user’s arrival on the website. When the user completes a form, these stored UTM values are then passed into hidden fields within the form. This seamless integration ensures that sales teams in the CRM have immediate access to the marketing source, medium, and campaign that generated the lead, allowing for more informed follow-ups and precise marketing ROI calculations. This approach closes the loop between marketing efforts and sales outcomes, providing a holistic view of customer acquisition.
Addressing Data Discrepancies: Troubleshooting Misattributed Traffic
The efficacy of UTM parameters is directly proportional to their consistent and accurate implementation. Misattributed traffic is a common symptom of poor or absent UTM usage, leading to skewed reports and misinformed strategic decisions. Industry experts often highlight specific warning signs:
Too Much Direct Traffic
A disproportionately high percentage of "Direct" traffic (often 25-30% or more) in analytics reports frequently signals a failure to implement UTM parameters effectively. Google Analytics endeavors to automatically categorize traffic sources, but without the explicit tagging provided by UTMs, many sessions default to "Direct." This can erroneously suggest high brand recognition or direct navigation, when in reality, it may stem from untagged email campaigns, dark social shares, or links from documents. The implication is a significant blind spot in understanding true traffic origins, leading to misallocation of marketing resources and inaccurate ROI measurement.
Wrong Source Bucket Attribution
Traffic appearing under an incorrect source bucket is another prevalent issue. This typically arises when parameter values do not align with Google Analytics’ default channel groupings. For instance, if a marketing team uses utm_medium=psoc (for paid social) instead of the recognized utm_medium=paid for social media advertising, GA4 might misclassify this traffic as "Organic Social" instead of "Paid Social." Such miscategorization distorts the performance analysis of paid channels, making it difficult to assess ad spend effectiveness. Adhering to Google’s standard regular expressions for channel grouping is paramount for accurate attribution.
Fragmented Traffic
Inconsistent naming conventions are a primary cause of fragmented traffic. Using variations such as utm_source=Facebook, utm_source=facebook, and utm_source=FB for the same platform will result in each variation being reported as a distinct source in GA4. This fragmentation scatters valuable data across multiple entries, making it challenging to aggregate and analyze the true performance of a single platform. Establishing and strictly adhering to standardized naming conventions across all marketing teams is a critical best practice to ensure data cohesion and analytical integrity.
The Mandate for Precision: Concluding Thoughts on UTMs in GA4
The transition to Google Analytics 4, coupled with an increasingly privacy-focused digital landscape, has cemented the role of UTM parameters as an indispensable tool for digital marketers and analysts. Mastery of UTM implementation and analysis within GA4 is no longer a niche skill but a fundamental requirement for any organization committed to data-driven decision-making.
This guide has elucidated how to systematically decode and leverage UTM parameters within GA4, from the foundational standard traffic acquisition reports to the advanced customization offered by Exploration Reports. The ability to filter, segment, and compare data based on precise campaign attributes empowers marketers to glean actionable insights, optimize campaigns in real-time, and demonstrate tangible marketing ROI.

Furthermore, integrating custom UTM parameters and passing this critical attribution data to CRM systems ensures a holistic view of the customer journey, bridging the gap between initial touchpoint and final conversion. By addressing common pitfalls like misattributed traffic through rigorous adherence to best practices, organizations can safeguard the integrity of their data and ensure that their analytical efforts yield maximum strategic value.
The data gathered through meticulously implemented UTMs forms the bedrock for advanced visualizations in platforms like Looker Studio or integration into third-party business intelligence tools, enabling even more sophisticated reporting and predictive analytics. In an era where every marketing dollar must be accounted for, UTM parameters in GA4 serve as the essential compass for navigating the complex digital terrain and charting a course for sustained growth.
FAQ
**Can I analyze UTM parameters in Google Analytics 4 Exploration Reports?**
Yes, UTM parameters are fully analyzable within Google Analytics 4 Exploration Reports. By leveraging a blank exploration report, analysts can define custom dimensions for each UTM parameter (e.g., “Session source,” “Session medium,” “Session campaign”) and combine them with relevant metrics like “Sessions” or “Transactions.” This highly flexible environment allows for the creation of bespoke reports to dissect campaign performance, understand user behavior from specific sources, and identify the most impactful marketing initiatives.
**How can I compare different versions of UTM content in Google Analytics 4?**
To conduct comparative analysis of different UTM content versions in Google Analytics 4, Exploration Reports offer a powerful segmentation feature. After adding “Session manual ad content” (which corresponds to `utm_content`) as a dimension, analysts can create distinct segments for each content version (e.g., “Start_Shopping_Button_V1” vs. “Start_Shopping_Button_V2”). These segments can then be applied side-by-side in the “Segment Comparisons” section of the report, allowing for direct comparison of metrics such as sessions, conversions, and revenue, thereby identifying which content variant yields superior results.
**Can I create segments and audiences based on UTM parameters in Google Analytics 4?**
Absolutely. Google Analytics 4 allows for the creation of both segments and audiences based on UTM parameters. Within Exploration Reports, specific UTM dimensions can be filtered to isolate particular traffic cohorts (e.g., users from `utm_source=newsletter` and `utm_medium=email`). This filtered selection can then be converted into a reusable segment for ongoing analysis. Furthermore, these segments can be published as audiences, enabling remarketing efforts through platforms like Google Ads or for further analysis within GA4’s Audience section, providing a powerful mechanism for targeted engagement.
