
Navigating the Labyrinth of User Metrics: A Deep Dive into Google Analytics 4’s "Unique Visitors"
Last Modified: March 26, 2025
In the dynamic realm of digital analytics, the sheer volume of metrics can often overwhelm even seasoned professionals. From total users and active users to new users, returning users, sessions, and beyond, the data points are seemingly endless. This complexity is compounded by the fact that what one platform defines as a "metric" can significantly differ in another, necessitating a profound understanding of each term for any meaningful analysis.
Among these crucial metrics, "visitors" have long stood as a foundational element in web analytics, offering a primary lens through which to measure a site’s performance. With the advent of Google Analytics 4 (GA4), the concept of a "unique visitor" has evolved, introducing new definitions and nuances that are critical for accurate interpretation. This comprehensive guide delves into the specifics of user identification within GA4, exploring its terminology, tracking mechanisms, practical applications, and inherent limitations.
The Evolution of User Measurement: From Unique Visitors to Engaged Users
The transition from Universal Analytics (UA) to Google Analytics 4 (GA4) marked a significant shift in how user engagement and identity are conceptualized and measured. While UA prominently featured "Unique Visitors" as a core metric, GA4 has introduced a more sophisticated, event-driven model that redefines user interaction. This evolution, a chronological progression in Google’s approach to web analytics, aims to provide a more holistic and user-centric view across websites and applications.
In GA4, the direct equivalent of "unique visitors" as a standalone metric is absent. Instead, the platform prioritizes metrics like "Total users" and "Active users," which, while similar in concept, carry distinct definitions and implications. Understanding this paradigm shift is paramount for analysts migrating from UA or embarking on their GA4 journey.

Deciphering GA4’s User Metrics: Total, Active, New, and Returning Users
At its core, a "visitor" is simply an individual who accesses your website or app on a device. A "unique visitor" traditionally referred to a person counted once within a specific timeframe, regardless of how many times they visited during that period. GA4 operationalizes this uniqueness through its "user" metrics.
What are Unique Visitors in Google Analytics 4?
While the term "unique visitor" isn’t a direct metric, its essence is captured by GA4’s "Total users" and "Active users." These metrics strive to identify individual users, even if they interact with your platform multiple times. The challenge, however, arises when a single individual uses multiple devices or browsers – a complexity GA4 attempts to address through its identity resolution capabilities, though with acknowledged limitations.
- Total Users: Google defines Total users as unique users who trigger any event on your site or app within a specified date range. An event can be anything from a page view to a custom interaction. Crucially, even a basic event like a
page_viewwill register a unique user. Custom events, configured to meet specific business objectives (e.g., asign_upevent upon successful form submission), also contribute to this count. - Active Users: This metric represents a more refined measure of engagement. Active users are those who have engaged with your website or app during a specified date range. A user is considered "engaged" if they meet any of the following conditions:
- They have engaged sessions.
- GA4 collects a
first_visitevent (for websites) orfirst_openevent (for apps). - GA4 collects a
session_startevent. - GA4 collects a
user_engagementevent.
The distinction between "Total users" and "Active users" often sparks confusion. An engaged session is crucial here: it occurs when a user stays on a page or app for more than 10 seconds, views more than one page, or triggers a conversion event. The user_engagement event itself is triggered when a webpage is in focus or an app is in the foreground for at least one second. While official documentation states this minimum, practical observations suggest it can fire either just before navigating to a new page or after approximately 10 seconds of active engagement on the same page.
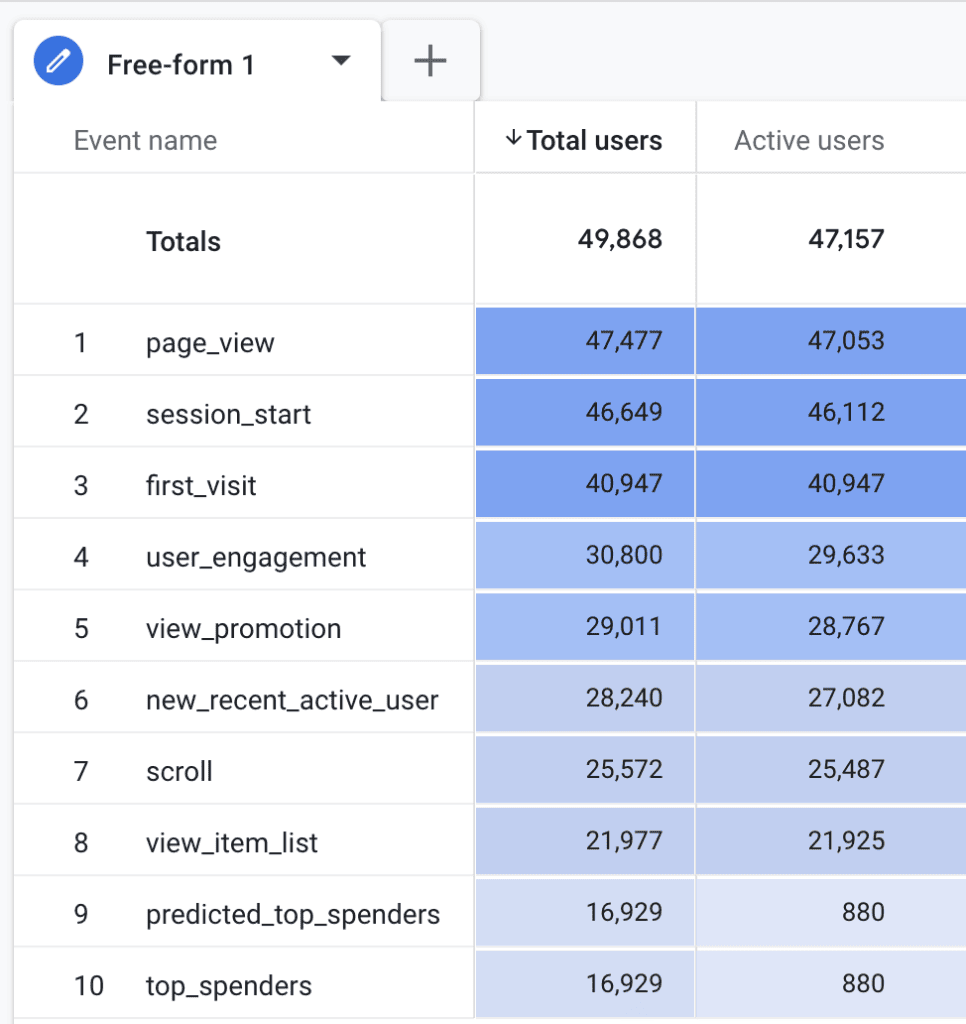
Given these definitions, it’s common for the numbers for "Total users" and "Active users" to be remarkably close, as most interactions will likely qualify a user as "active." For instance, an analytical snapshot often reveals near-identical figures for both metrics, highlighting the close relationship between merely "triggering an event" and "being engaged." (Referencing the provided image: "Total users and active users comparison in GA4"). In most standard reports, GA4 prioritizes "Active users," but either metric can serve as a valuable approximation.
However, discrepancies between Total and Active users can arise due to various factors:
- Data Thresholding: GA4 applies data thresholds to protect user privacy, which can affect user counts, especially for smaller data sets.
- Reporting Identity: Different reporting identities (Device-based, User-ID, Google signals, Blended) can influence how users are identified and deduplicated.
- Sampling: For large data sets in certain reports, GA4 might sample data, leading to approximations rather than exact counts.
- Bot Traffic: While GA4 has mechanisms to filter bot traffic, some may still get through, inflating user counts.
- Cookie Consent: Users declining cookies might not be tracked consistently, leading to undercounting or fragmented user journeys.
- Ad Blockers: Privacy-focused browsers and ad blockers can interfere with tracking scripts and cookie storage, impacting user identification.
- Incomplete Sessions: Users who trigger an event but don’t meet the engagement criteria (e.g., bounce immediately without an engaged session) might be counted as "Total users" but not "Active users."
Beyond these primary user types, GA4 also offers:
- New Users: Individuals who visit your site or app for the first time within the selected date range.
- Returning Users: Individuals who have previously visited your site or app and return within the selected date range.
A crucial nuance here is that a single user can be counted in both "New users" and "Returning users" metrics within a broad date range. For example, if a user first visits on March 2nd and returns on March 7th, and your report covers March 1st to March 10th, they will appear in both categories. This highlights the importance of understanding metric definitions rather than simply summing them up. It’s also worth noting that "Active users" are often simply labeled as "Users" in various GA4 interfaces, a detail that can initially cause confusion.
The Mechanism of User Tracking: Client ID and Cookies
Google Analytics 4 relies on a sophisticated mechanism to identify and track unique users across sessions. This process primarily hinges on the Client ID (CID), a unique identifier stored in a visitor’s browser cookie.
Official Responses: How GA4 Tracks Users
The Client ID, often referred to as _ga in first-party cookies, is a randomly generated string (e.g., 1242591205.1741664478) that assigns a distinct identifier to each new "session." This allows GA4 to differentiate between a user’s initial visit and subsequent returns, tying all their actions to this specific ID. The second part of the CID, after the period, represents the creation timestamp of the client ID in UNIX format.
By default, the _ga cookie has a 2-year expiration time. However, this setting can be modified within the GA4 interface to align with various privacy regulations (e.g., GDPR, CCPA). Analysts can set cookie expiration from a maximum of 25 months down to 1 month, 1 week, 1 day, 1 hour, or even 0 (session-based expiration).
It is vital to recognize that privacy-focused browsers, particularly on platforms like iOS, impose their own limitations on cookie lifespan, often reducing it to 7 days or even 24 hours. Such restrictions can lead to an inflation of "new user" counts, as a returning user might be assigned a fresh Client ID after their previous cookie expires prematurely, even though the underlying individual is the same.
The Client ID is distinct from a User ID, which is a more robust, cross-device identifier that can track users across different browsers and devices once implemented by the business. The Client ID, being cookie-based, is inherently limited:
- Browser-Specific: It cannot track users across different browsers on the same device.
- Device-Specific: It cannot track users across multiple devices.
- Ephemeral: Deleting the
_gacookie or a browser’s early expiration policy will result in a new Client ID being generated on the next visit, counting the user as "new." - Ad Blocker Impact: Ad blockers or browser settings that prevent cookie storage can entirely block tracking, meaning users won’t be counted.
Understanding these technical underpinnings is crucial for interpreting GA4 data accurately and for setting realistic expectations regarding the precision of "unique user" counts.

Locating User Data in Google Analytics 4 Reports
GA4 seamlessly integrates user metrics across its reporting interface, making them accessible in various contexts. While "Active users" is often the default or favored metric in standard reports, "Total users," "New users," and "Returning users" are also readily available to provide a comprehensive view of your audience.
Supporting Data: Where to Find User Metrics
You will find user metrics embedded throughout GA4’s "Reports" section, offering insights at a glance or in more granular detail:
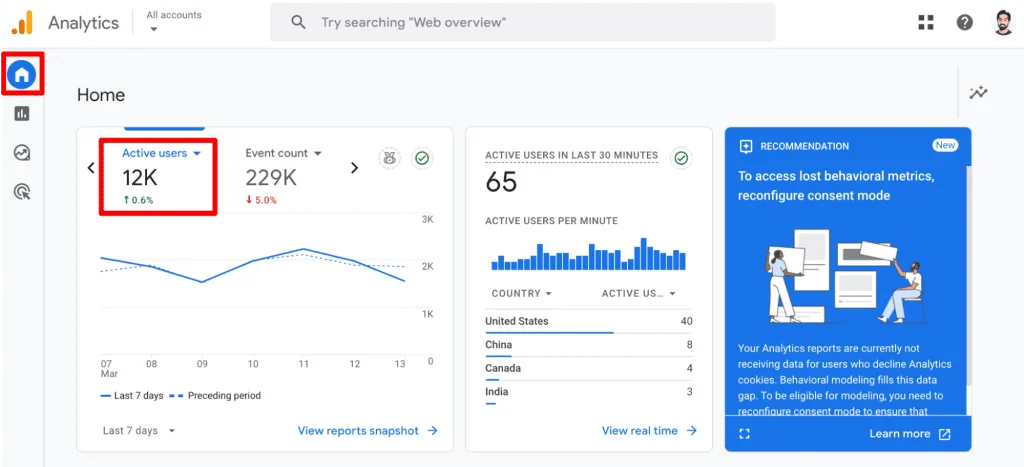
- Home: Provides a quick overview of Active users compared to previous periods. (Referencing image: "Active users in GA4 Reports Home").
- Reports snapshot: Displays summaries for Active and New users, along with contextual insights like geographical distribution and acquisition sources for new users. (Referencing image: "GA4 Reports snapshot").
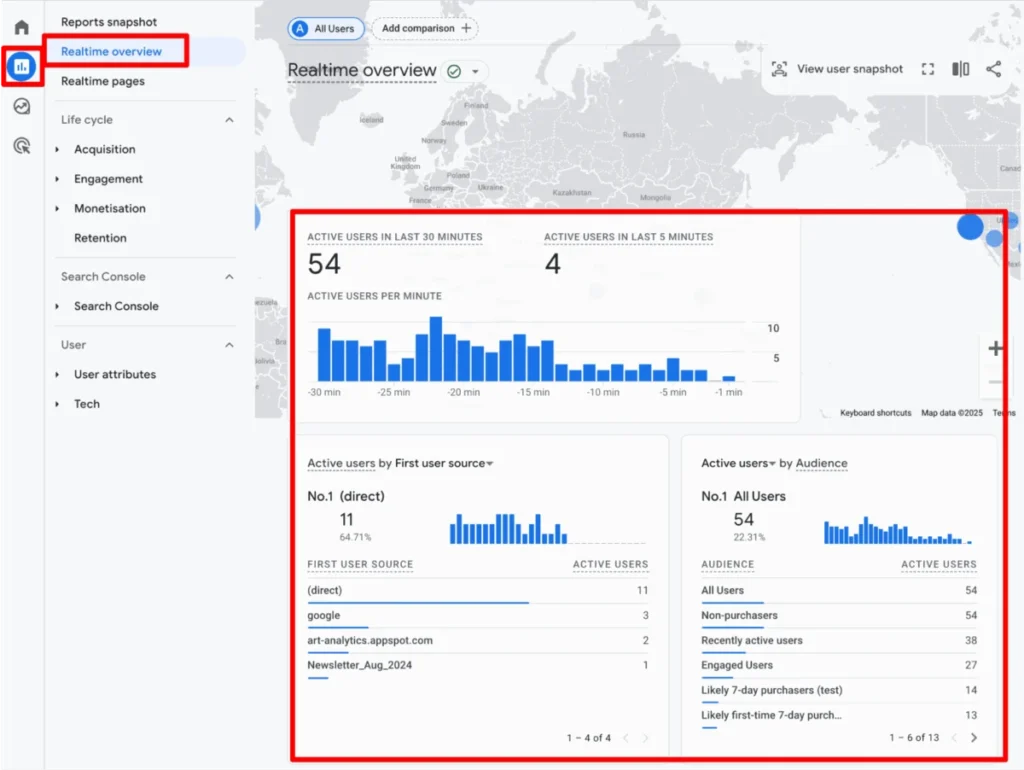
- Realtime overview: Shows current Active users on your site or app in the last 30 minutes. (Referencing image: "GA4 Realtime overview").
- Realtime pages: Similar to the overview, but lists the specific pages currently being viewed by Active users. (Referencing image: "GA4 real-time pages").
- Acquisition > Overview cards: Summarizes Active and New users data related to acquisition channels.
- Acquisition > User acquisition: Details Total, New, and Returning users based on their acquisition source.
- Acquisition > User acquisition cohorts: Focuses on New users and their retention over time.
- Engagement > Overview cards: Provides an overview of engagement metrics, including Active users.
- Engagement > Events: Lists various events and the Total users who triggered them.
- Engagement > Pages and Screens: Shows engagement with specific content, including Active users per page.
- Engagement > Landing pages: Identifies the entry points to your site, detailing Active and New users for each.
- Monetization > Overview cards, Purchase, and Checkout journey: Integrates Active users into eCommerce funnels.
- Retention: Presents data on New and Returning users to analyze user loyalty and churn.
- User attributes > Overview cards: Provides high-level insights into audience characteristics, including Active users.
- User attributes > Demographic details: Offers demographic breakdowns of Active and New users.
- User attributes > Audiences: Analyzes the performance of defined audiences, including New and Total users.
- Tech > Overview cards: Summarizes user data by technology used, including Active users.
- Tech > Tech details: Offers granular insights into the technology used by Active and New users.
For advanced analysis and custom reporting, GA4’s "Explore" section (formerly "Explorations") allows users to build free-form reports. Here, all available user metrics can be utilized, though certain combinations may be disabled if they are incompatible with the chosen dimensions or report type. (Referencing image: "User metrics in GA4 explorations"). The flexibility of "Explore" empowers analysts to construct highly specific views of user behavior.
Maximizing Insights: Best Practices for Using Unique User Data
Leveraging user data effectively in GA4 extends beyond merely locating the numbers. Adopting best practices ensures that the insights derived are accurate, actionable, and contribute meaningfully to business objectives.

- Validate Your Tracking Setup to Prevent Duplication: One of the most critical steps is ensuring your GA4 tracking is correctly implemented. Duplication can occur if GA4 is installed directly on the website, via a plugin, and through Google Tag Manager (GTM) simultaneously. While this often leads to duplicate events (e.g., two page views for a single visit), it can also distort user counts or misattribute actions to a single user, hindering an accurate understanding of their journey. Regular audits and a standardized process for tracking modifications are essential.
- Regularly Monitor Data for Anomalies: Proactive monitoring of user metrics for unusual spikes or dips is crucial. Such anomalies can signal underlying issues—technical glitches, successful marketing campaigns, bot attacks, or changes in user behavior. Implementing GA4’s "custom insights" with email notifications can automate this process, ensuring prompt awareness and investigation of significant data shifts.
- Understand the Aggregation of User Metrics: User metrics in GA4 are inherently aggregated. Attempting to sum "users" across different dimensions (e.g., adding up daily user counts to get a weekly total) will lead to inaccuracies because the same user might visit on multiple days. GA4 already deduplicates users within a selected date range. For precise individual user analysis, especially when summing across time or dimensions, accessing the
user_pseudo_idin tools like BigQuery is necessary. - Segment Your Audience for Deeper Insights: Raw user counts provide a high-level view, but segmentation unlocks profound insights. By breaking down your user base by dimensions like traffic source, device type, geographical location, or content consumed, you can answer critical questions:
- Which traffic sources bring the most engaged users?
- Are mobile users behaving differently from desktop users?
- What content resonates most with converting users?
- Where are your most valuable users located?
Segments help identify high-value user groups, enabling tailored marketing strategies, personalized experiences, and optimized conversion funnels.
- Analyze New vs. Returning Users Strategically: Do not sum "New users" and "Returning users" to equate "Total users," as a single user can fall into both categories within a given date range. Instead, analyze these groups separately to understand distinct behavioral patterns:
- High New Users, Low Returning Users: Suggests effective acquisition but poor retention. Focus on retention strategies like email nurturing, remarketing, and enhancing the initial user experience.
- Low New Users, High Returning Users: Indicates strong customer loyalty and retention but weak acquisition. Prioritize strategies to attract new audiences while continuing to optimize the experience for existing loyal users.
Monitoring these trends helps gauge the health of your acquisition and retention efforts, crucial for sustainable growth and customer lifetime value.
These best practices underscore that the value of user data lies not just in its collection but in its intelligent application. Accurate user counts, for instance, are foundational for reliable A/B testing and marketing campaign evaluation.
Navigating the Nuances: Limitations of Unique User Data in GA4
Despite GA4’s advanced capabilities, its user metrics, like all analytical data, come with inherent limitations. Awareness of these constraints is vital for accurate interpretation and for avoiding flawed conclusions.
- Data Thresholding and Privacy: GA4 employs data thresholding to prevent individuals from being identified based on sparse data, particularly for demographic or interest reports. If user counts are too low, GA4 may withhold data, showing "N/A" or aggregated ranges. This is a privacy safeguard but can limit granular analysis, especially for smaller websites or niche segments.
- Identity Resolution Challenges (Cross-Device/Browser): While GA4 offers various reporting identities (Device-based, User-ID, Google signals, Blended), achieving perfect cross-device and cross-browser user identification remains a significant challenge. Without a robust User-ID implementation (which requires users to log in), GA4 relies on cookies and Google signals, which are not infallible. A single user interacting from multiple devices or browsers without logging in may be counted as multiple unique users.
- Impact of Cookie Consent and Browser Privacy Features: The increasing emphasis on user privacy, including stricter cookie consent regulations (e.g., GDPR, CCPA) and browser features like Apple’s Intelligent Tracking Prevention (ITP), directly impacts GA4’s ability to track users consistently. If users decline cookies, their activity may not be tracked at all, or their Client ID might be reset prematurely, leading to inflated "new user" counts.
- Bot Traffic and Data Cleanliness: While GA4 has built-in bot filtering, no system is perfectly immune to sophisticated bot traffic. Unfiltered bot activity can artificially inflate user counts and distort engagement metrics, painting a misleading picture of real human interaction. Regular review of traffic sources and anomalous patterns is necessary to identify and mitigate such issues.
- Sampling in Large Datasets: For properties with very high traffic or when running complex queries, GA4 may apply data sampling to process reports more efficiently. When data is sampled, the reported numbers are estimates rather than precise counts, which can affect the reliability of detailed analyses. While often negligible, for critical decision-making, understanding when sampling occurs and its potential impact is important.
- Discrepancies with Other Analytics Tools: It’s common for user counts in GA4 to differ from those reported by other analytics platforms (e.g., server logs, CRM systems, other third-party tools). These discrepancies stem from varying tracking methodologies, definitions of "user," cookie policies, bot filtering mechanisms, and data processing times. It’s crucial to understand that no single tool offers an absolute "true" count, but rather a measurement based on its specific parameters.
Acknowledging these limitations allows analysts to approach GA4 data with a critical eye, contextualize their findings, and communicate insights with appropriate caveats.
Conclusion: Mastering GA4’s User Metrics for Strategic Advantage
This exploration has delved into the multifaceted world of "unique visitors" as understood and measured within Google Analytics 4. We’ve navigated the shift from Universal Analytics’ direct terminology to GA4’s more nuanced "Total users" and "Active users," clarifying their definitions and the intricate concept of engaged sessions.
We examined the 18 distinct locations within standard GA4 reports where various user metrics can be found, highlighting the flexibility offered by "Explore" for custom analysis. Crucially, we outlined best practices—from validating tracking setups and monitoring anomalies to segmenting audiences and strategically analyzing new versus returning users—all designed to transform raw data into actionable intelligence. Understanding why simple summation of user metrics can be misleading was also emphasized.

Finally, we addressed the critical limitations inherent in GA4’s user tracking, including data thresholding, identity resolution challenges, the impact of privacy features, bot traffic, and data sampling. Awareness of these nuances is not a deterrent but an empowerment, enabling analysts to interpret data more accurately and make more informed strategic decisions.
Mastering GA4’s user metrics is fundamental for any organization seeking to understand its audience, optimize its digital presence, and drive meaningful growth. By embracing the complexity and applying these insights, businesses can truly leverage their analytics to forge stronger connections with their users.
For further insights into user engagement, explore our detailed post: GA4 User Engagement Made Visual and Simple.
How do you utilize your unique visitor data in GA4? What challenges have you encountered, and what solutions have you discovered? Share your experiences and insights in the comments below to enrich the collective knowledge of our readers and the analytics community.
