
Mastering the Metrics: The Definitive Guide to Social Media Engagement in 2026
In the rapidly evolving landscape of digital marketing, the vanity metrics of yesteryear—like total follower count or simple impressions—have been relegated to the background. In 2026, the gold standard for social media success is engagement rate. As algorithms become increasingly sophisticated, prioritizing meaningful human interaction over passive consumption, brands must shift their focus toward the specific actions that drive community growth and conversion.

Understanding and optimizing your engagement rate is no longer a luxury for social media managers; it is a necessity for proving ROI to stakeholders and ensuring your content doesn’t vanish into the digital abyss.

The Core Concept: What is Engagement Rate?
At its simplest, engagement rate is a performance metric that quantifies how your audience interacts with your content relative to its reach or your total follower base. It serves as a thermometer for your brand’s health, indicating whether your content is resonating with your target demographic or falling flat.
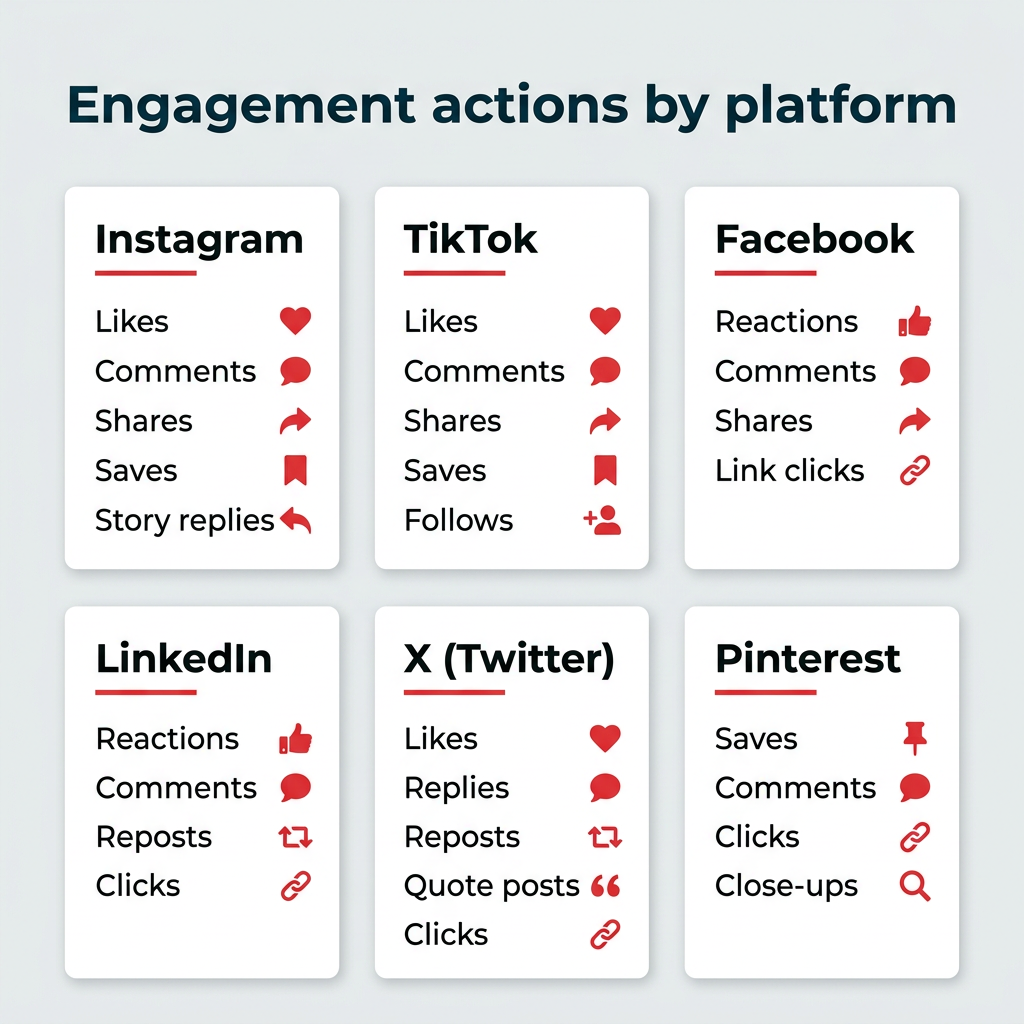
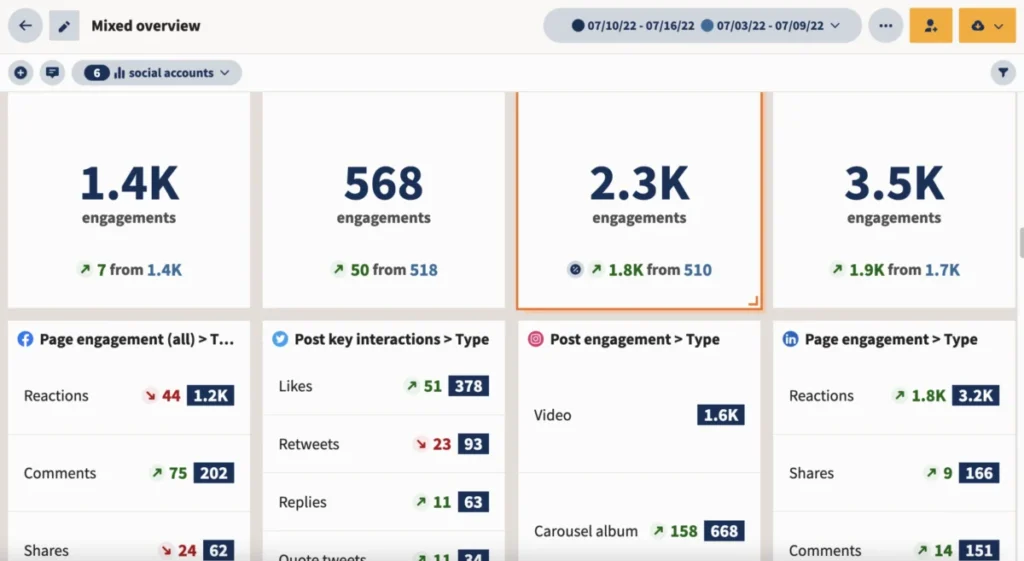
Engagement encompasses any active step a user takes to interact with your post. While definitions vary slightly by platform, this typically includes:

- Likes and Reactions: The foundational signal of approval.
- Comments: A deeper indicator of interest and brand advocacy.
- Shares/Reposts: The ultimate signal of content value, extending your reach to new audiences.
- Saves/Bookmarks: A sign that the content provides long-term utility.
- Link Clicks: The transition from social platform to your owned digital property.
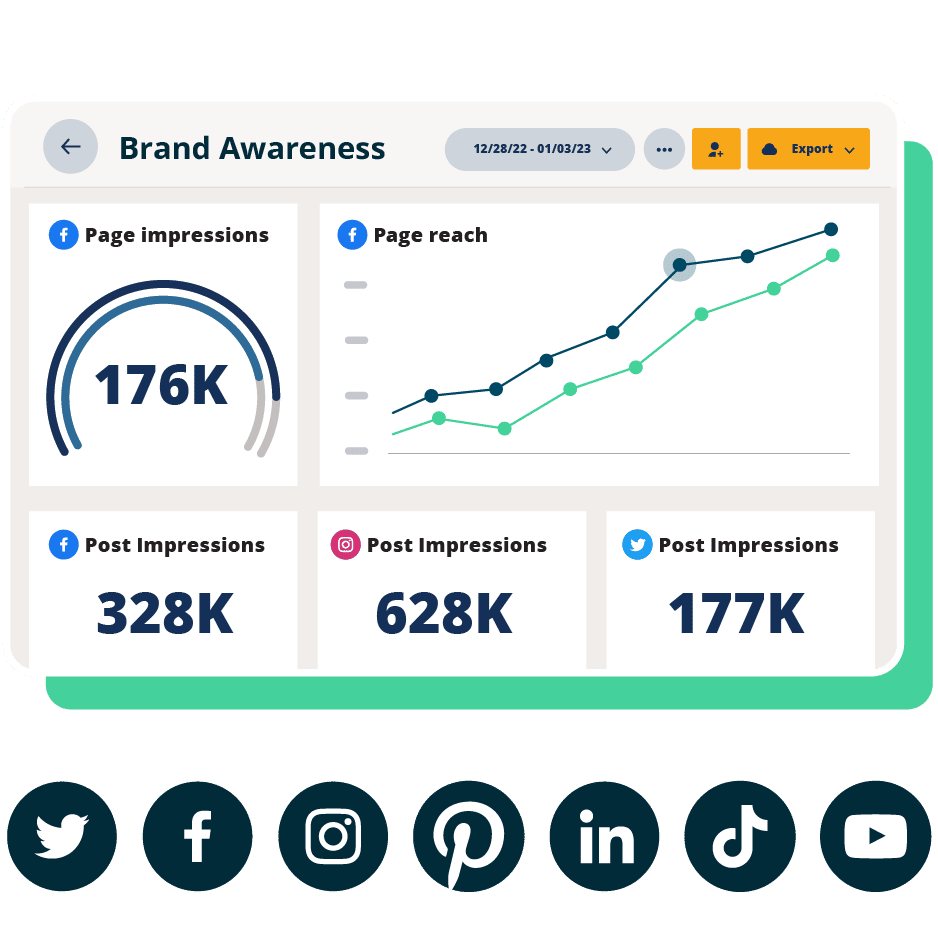
Unlike "passive" metrics such as impressions or views—which merely measure exposure—engagement metrics measure intent. When a user engages, they are signaling that your brand has earned a moment of their time.
Why Engagement Matters: The Algorithm and Beyond
The importance of engagement rate is twofold: it provides internal data for strategy and sends external signals to platform algorithms.
1. Algorithm Optimization
Social media platforms (Instagram, TikTok, LinkedIn, etc.) are businesses that thrive on keeping users on their apps. Algorithms act as gatekeepers; they surface content that receives high engagement to a wider audience. If your engagement rate is high, the platform identifies your content as high-quality, granting you more organic reach.
2. Trust and Social Proof
A high engagement rate acts as social proof. When a first-time visitor lands on your profile and sees an active comment section and high interaction numbers, it builds immediate credibility. It tells the user that your brand is not only present but actively participating in a conversation.

3. Demonstrating ROI
For enterprise teams and agencies, engagement rate is the clearest bridge between content performance and business objectives. By tying engagement to specific campaign goals, managers can justify budget allocations to leadership, moving beyond the "we need to be on social" argument toward a data-driven strategy.
Decoding the Formulas: A Technical Breakdown
One size does not fit all in social analytics. Depending on your goals—whether you are running a brand awareness campaign or a targeted conversion drive—the formula you choose will dictate your data’s accuracy.
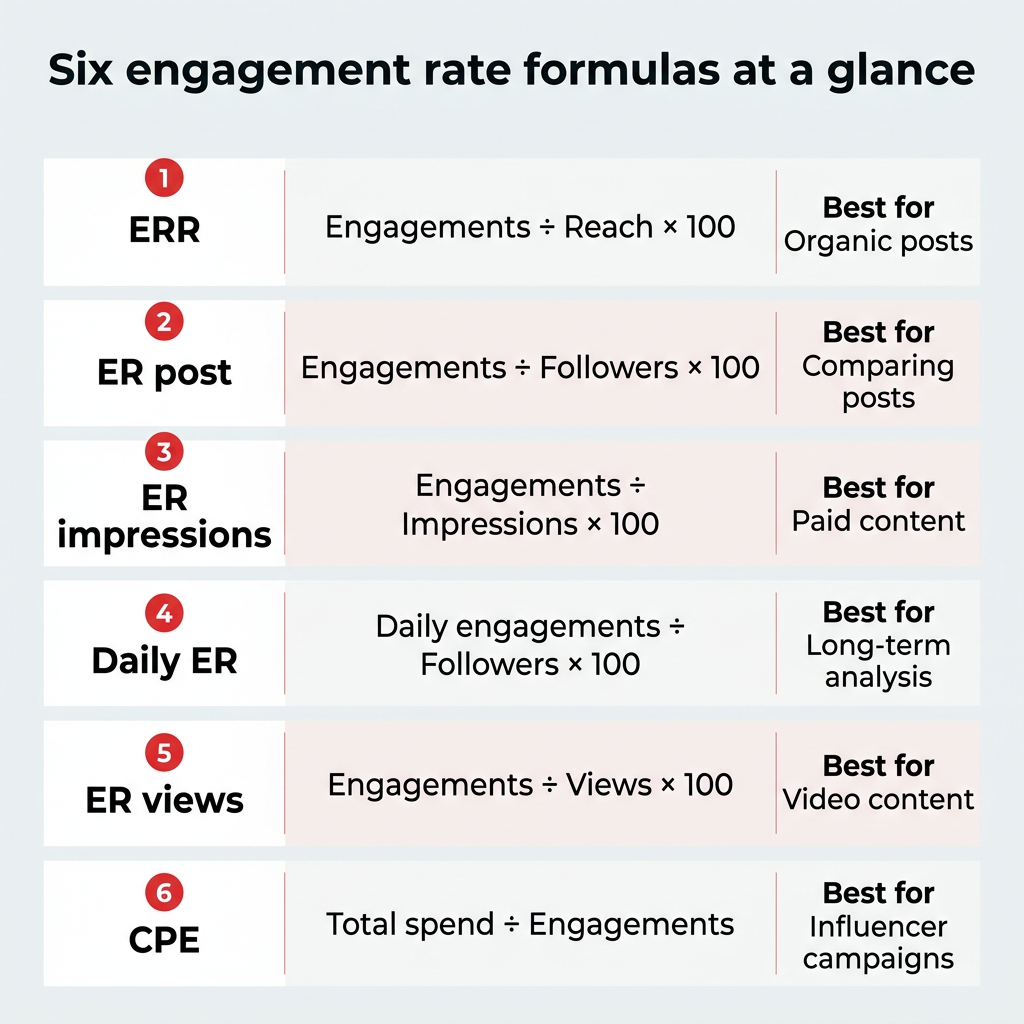
1. Engagement Rate by Reach (ERR)
This is widely considered the most accurate measure for organic performance.
- Formula: (Total Engagements / Total Reach) * 100
- Why use it: It filters out the "noise" of people who scrolled past your content without seeing it. It measures how effectively your content converts viewers into participants.
2. Engagement Rate by Post (ER Post)
- Formula: (Total Engagements / Total Followers) * 100
- Why use it: This is the industry standard for influencers and consistent content creators. It provides a stable baseline for comparing how your audience interacts with different posts over time.
3. Engagement Rate by Impressions (ER Impressions)
- Formula: (Total Engagements / Total Impressions) * 100
- Why use it: Essential for paid advertising. Since paid ads are often shown multiple times to the same user (frequency), this metric helps gauge how effective your creative is across every individual display.
4. Daily Engagement Rate
- Formula: (Total Daily Engagements / Total Followers) * 100
- Why use it: Ideal for long-term health checks. It captures the "background noise" of your account, including interactions on older posts, which provides a holistic view of community activity.
2026 Industry Benchmarks: Setting Your Goals
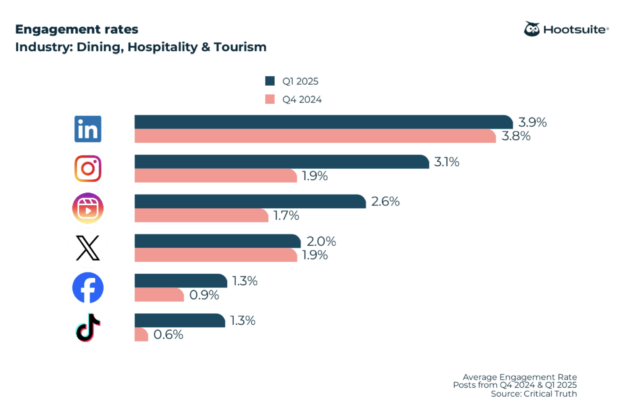
To understand if your engagement is "good," you must benchmark against your specific industry and platform. Data compiled from over one million social posts reveals that the average engagement rate typically hovers between 1% and 5%.
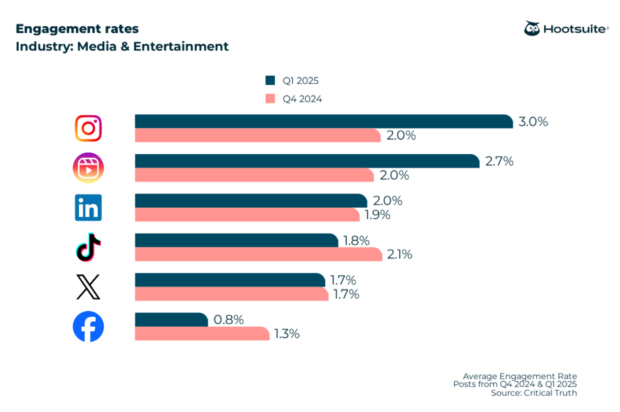
Cross-Platform Benchmarks (All Industries)
- Instagram: 3.0%
- Instagram Reels: 2.7%
- LinkedIn: 2.0%
- X (formerly Twitter): 1.8%
- TikTok: 1.5%
- Facebook: 0.8%
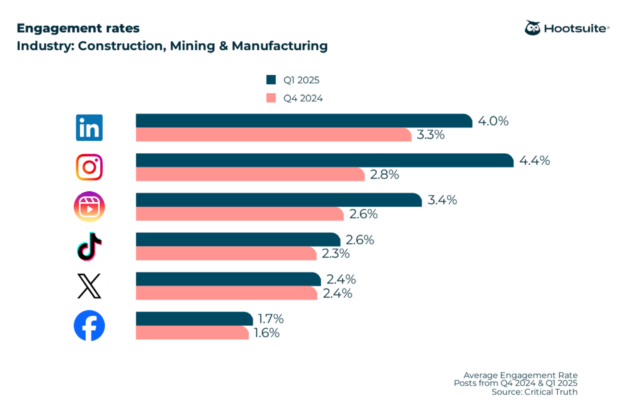
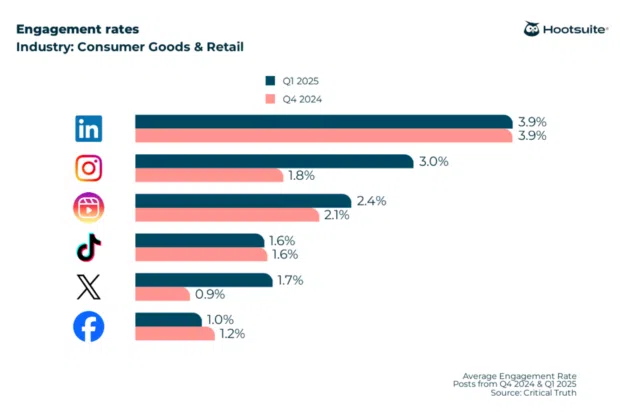
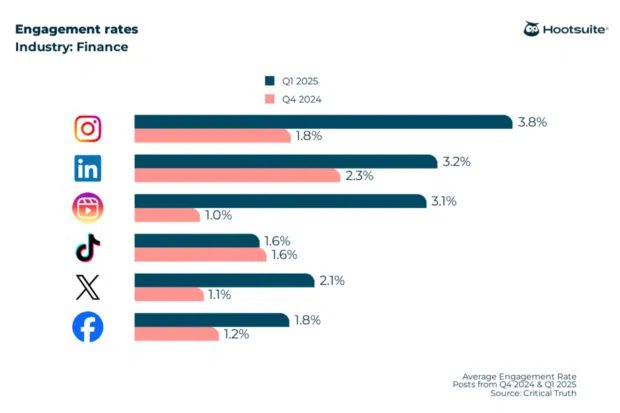
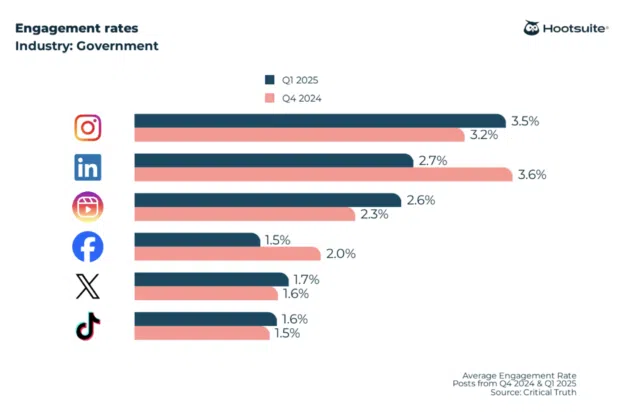
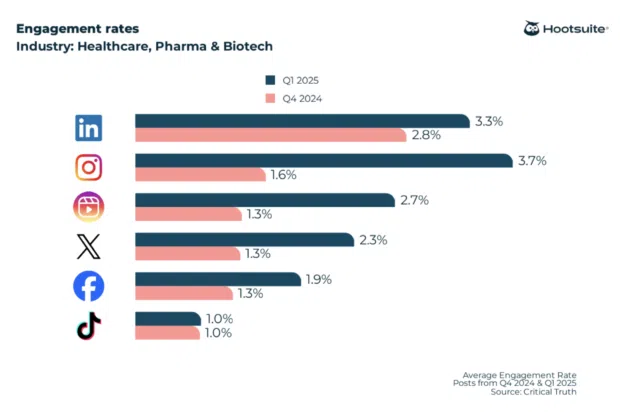
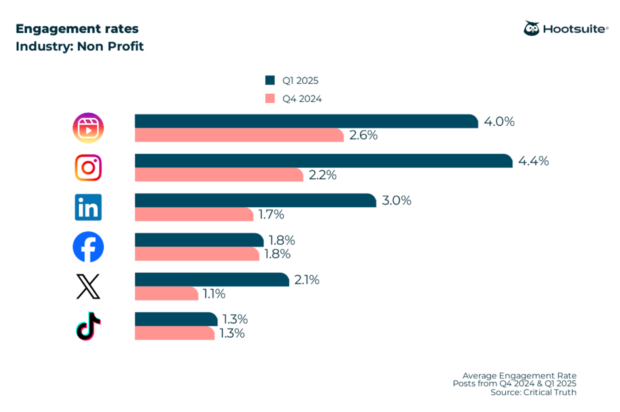
Industry-Specific Nuances
- Nonprofits and Retail: These sectors often see higher engagement, sometimes pushing above 4%, as their content is frequently driven by emotional storytelling or direct product utility.
- Finance and Healthcare: These sectors face more regulatory hurdles, often resulting in lower engagement rates. Success here is measured more by the quality of the conversation than the volume.
Tactical Implications: Improving Your Numbers
Improving your engagement rate is a process of iteration. Once you have established your baseline, follow these steps to scale your interaction:
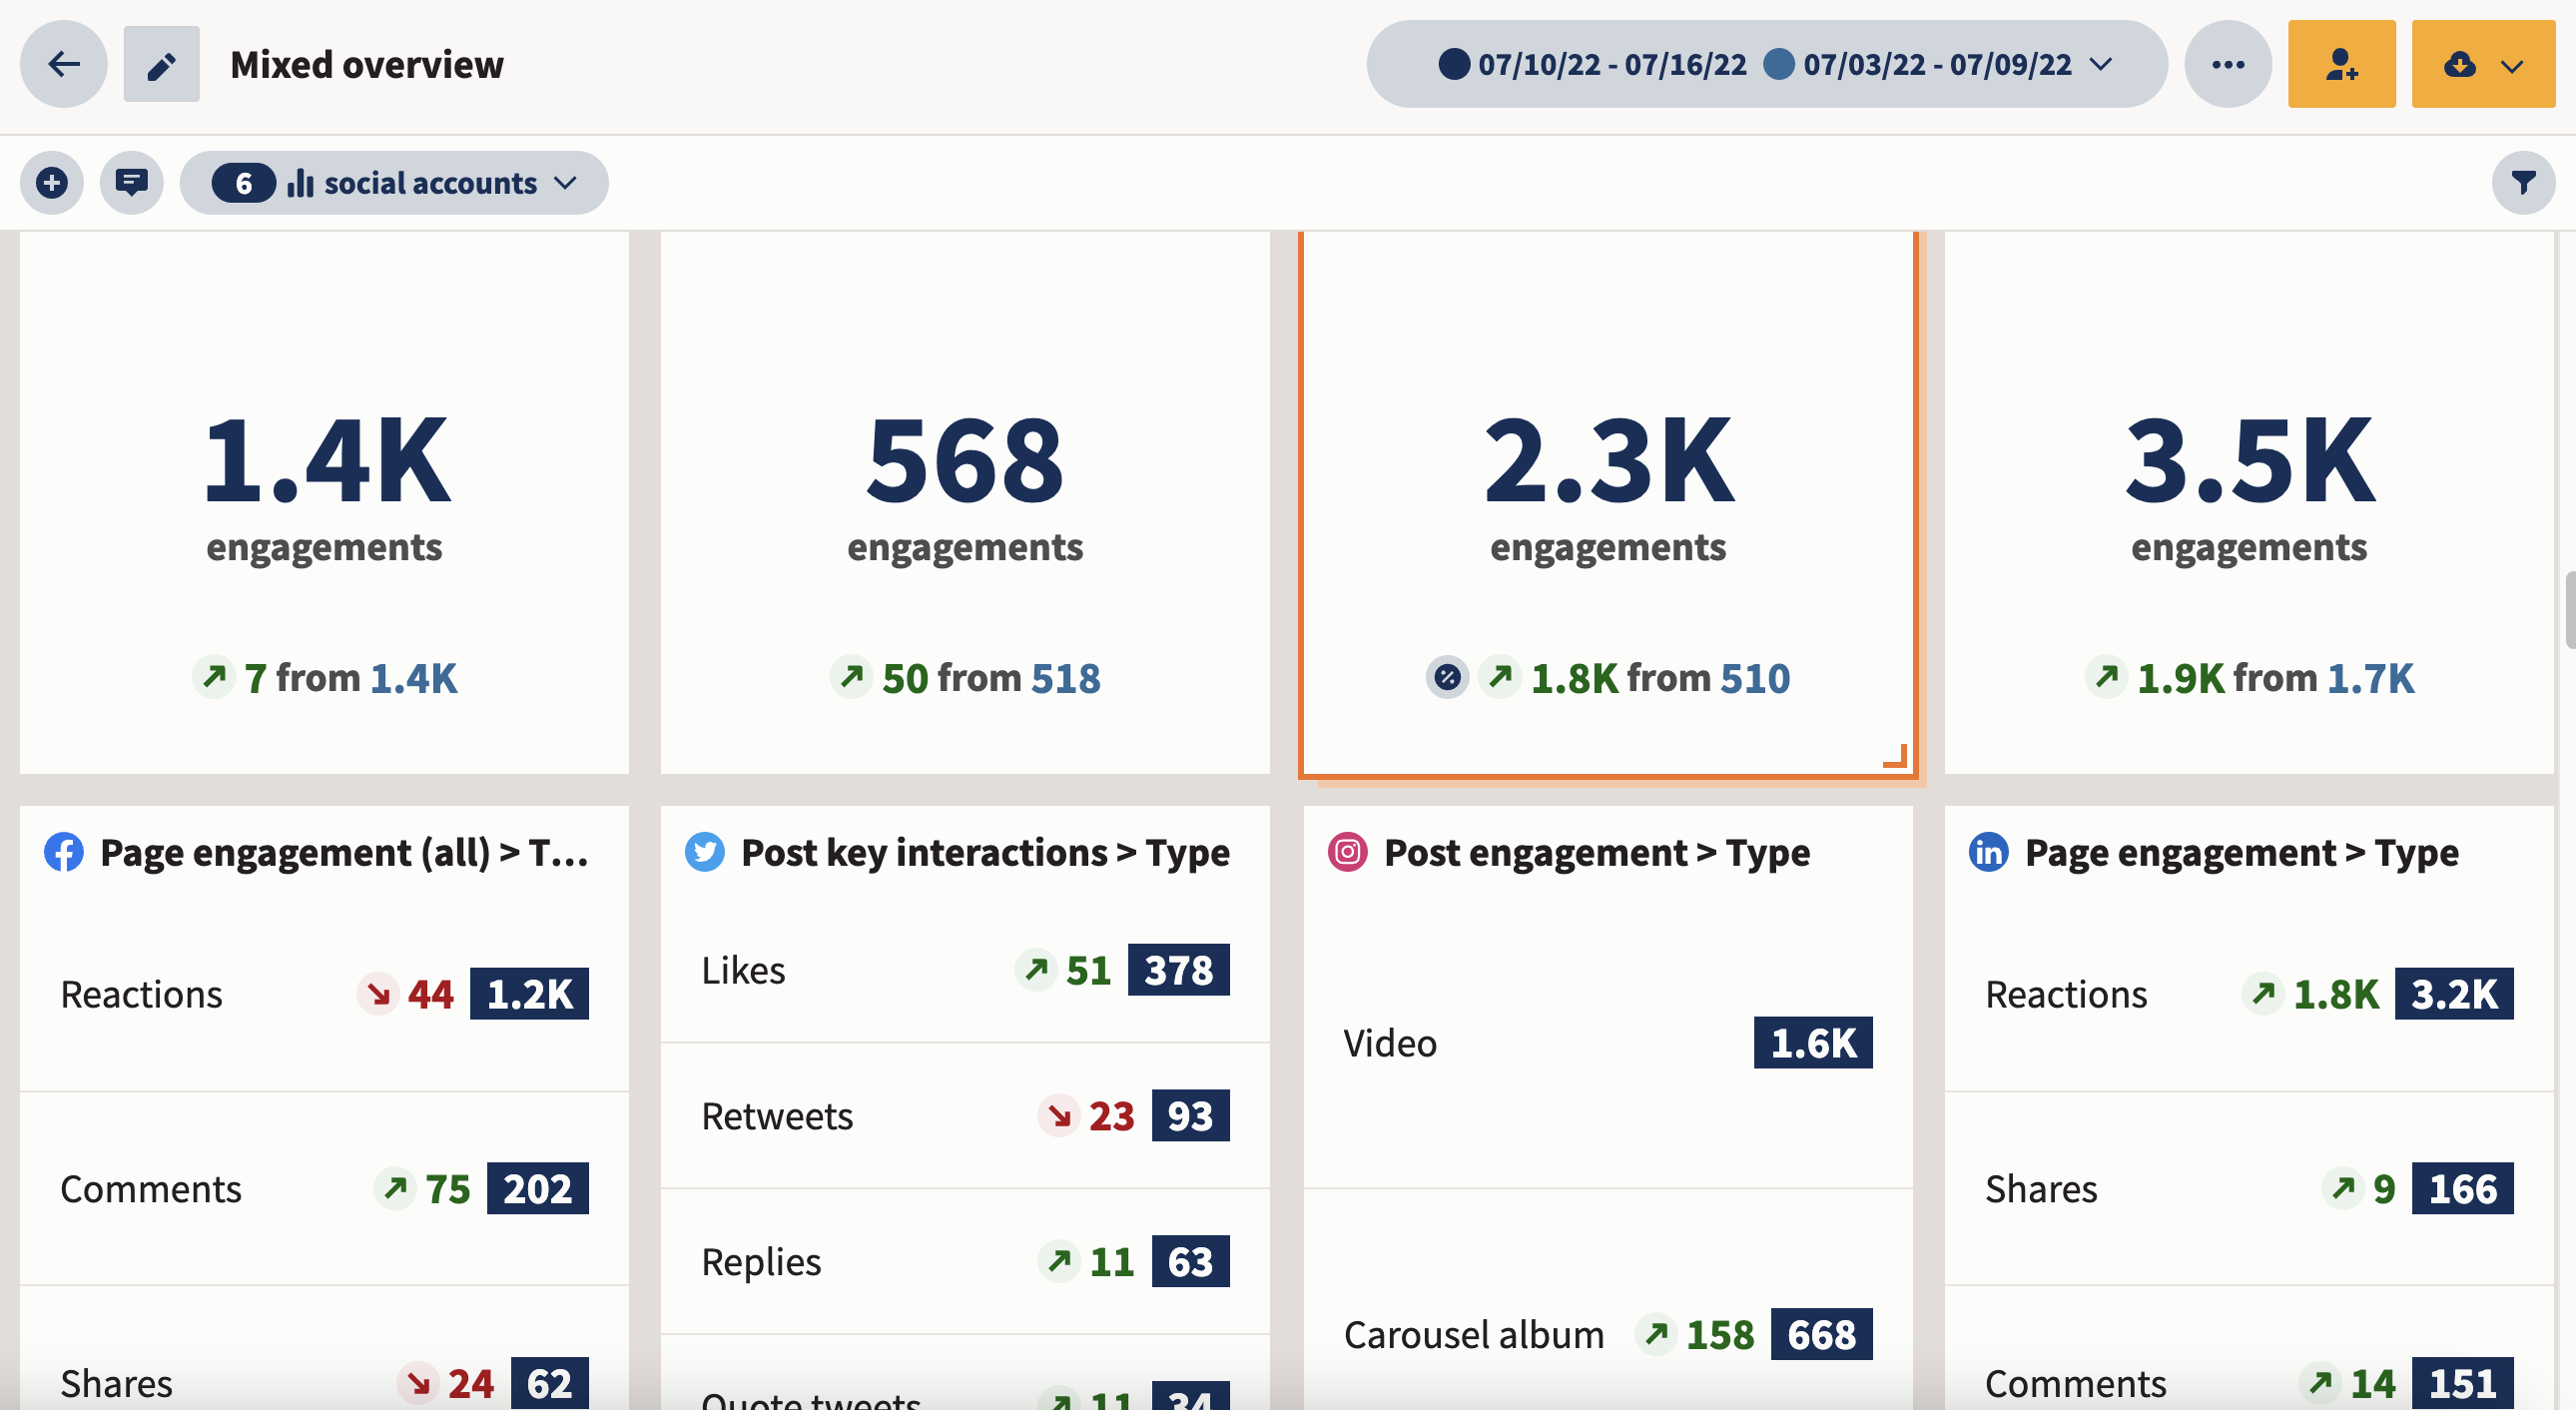
- Analyze the "What": Use your analytics dashboard to identify the top-performing 10% of your content. Look for commonalities in format (e.g., carousels vs. videos), tone, and subject matter.
- Optimize for Timing: Use "Audience Activity" heatmaps to ensure you are posting when your followers are most likely to be online.
- The "Call-to-Action" (CTA) Strategy: Don’t assume your audience knows how to engage. Use clear, low-friction CTAs, such as "Comment your thoughts below" or "Save this for your next project."
- Prioritize Community Management: Engagement is a two-way street. The brands that reply to comments, ask follow-up questions, and engage with their followers’ content in return see significantly higher loyalty and engagement rates.
- Leverage Video Formats: In 2026, short-form video remains the primary driver of discovery. Even if your brand is B2B, incorporating "human-first" video content can dramatically increase your reach and, consequently, your engagement.
Strategic Decision-Making: Moving Beyond the Data
Ultimately, the goal of calculating engagement rate is to inform your future strategy. It is not enough to simply track these numbers; you must use them as a compass.
If your ERR (Engagement Rate by Reach) is high but your follower growth is stagnant, your content is resonating with your existing community but failing to reach new people—perhaps suggesting a need for better hashtag usage or collaborations. Conversely, if your reach is high but your engagement is low, you are likely failing to provide enough value or failing to hook the viewer in the first three seconds of your content.
By automating your data collection through tools like Hootsuite, you can move away from manual spreadsheet entry and focus on the "why" behind the numbers. In the current marketing climate, the brands that win are those that treat engagement not as a static number, but as a dynamic conversation.
The Bottom Line: Your engagement rate is the pulse of your brand. Keep it strong by remaining consistent, listening to your data, and always putting the human element of social media first.
