

Mastering Social Media Analytics: The 25 Essential Metrics for 2026 Success
In the rapidly evolving landscape of digital marketing, the ability to translate social media activity into tangible business outcomes is no longer optional—it is a survival skill. As we move into 2026, where CMOs are increasingly under pressure to prove that social media spend directly contributes to revenue growth, vanity metrics have been officially relegated to the past. Success in the current climate requires a sophisticated, data-driven approach that aligns social performance with bottom-line objectives.
To navigate this complexity, marketers must move beyond surface-level likes and shares, focusing instead on a robust framework of 25 essential metrics. This guide provides a comprehensive roadmap for tracking, analyzing, and reporting on the data that actually moves the needle.

The Strategic Foundation: Metrics vs. KPIs
Before diving into the data, it is vital to distinguish between metrics and Key Performance Indicators (KPIs). Metrics are simply data points that measure what happened—a snapshot of engagement or reach. KPIs, by contrast, tie those results to specific business goals.
For example, "10,000 impressions" is a metric. "A 15% increase in qualified leads from Instagram this quarter" is a KPI. Every KPI is constructed using metrics, but a metric without a goal is merely noise. By utilizing the 70/20/10 rule—where 70% of content provides value, 20% shares third-party insights, and 10% is directly promotional—marketers can create a balanced scorecard that maps specific metrics to their corresponding content strategies.

Chronology of Measurement: From Awareness to ROI
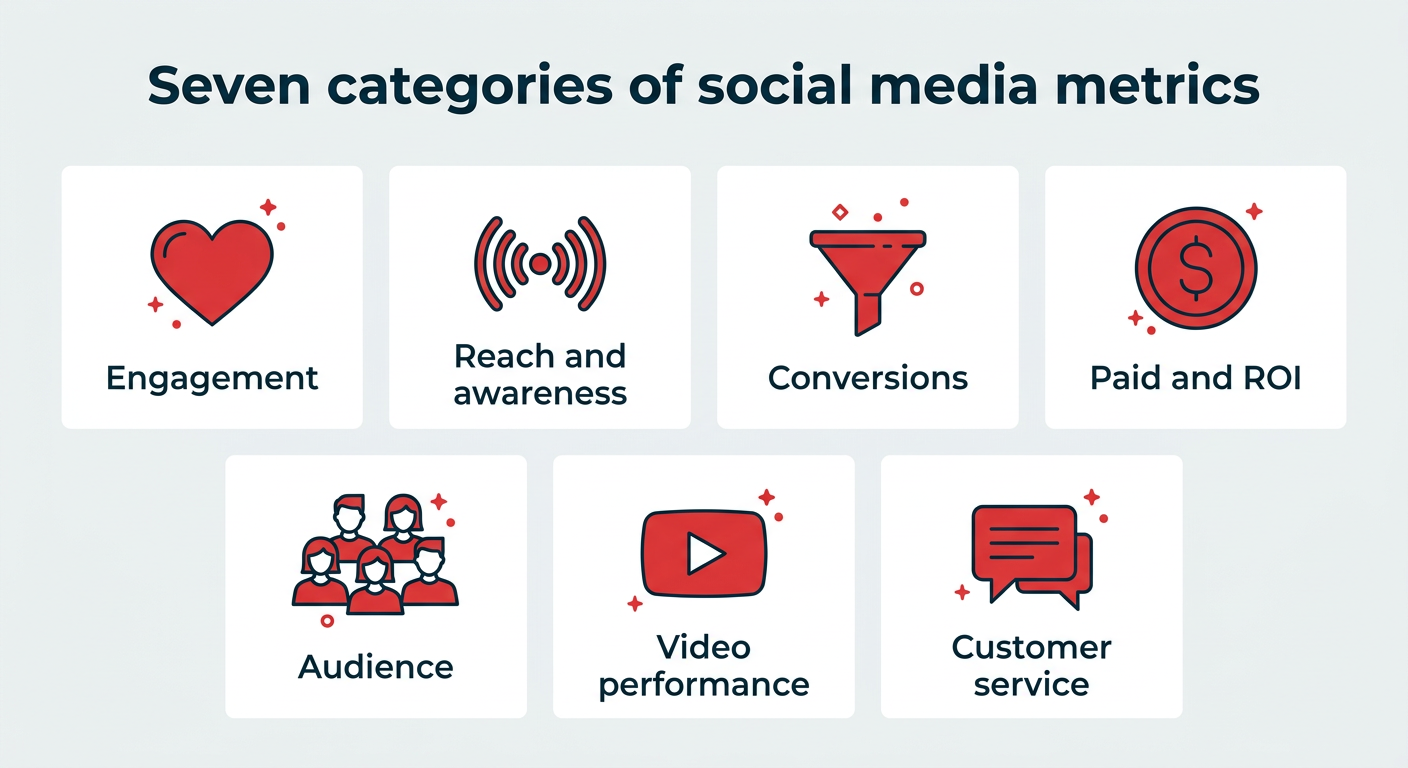
Effective measurement follows the customer journey. By understanding the chronological flow of how a user interacts with your brand, you can categorize your metrics into five functional pillars.
1. Reach and Awareness
These metrics answer the question: Is our brand being seen by the right people?
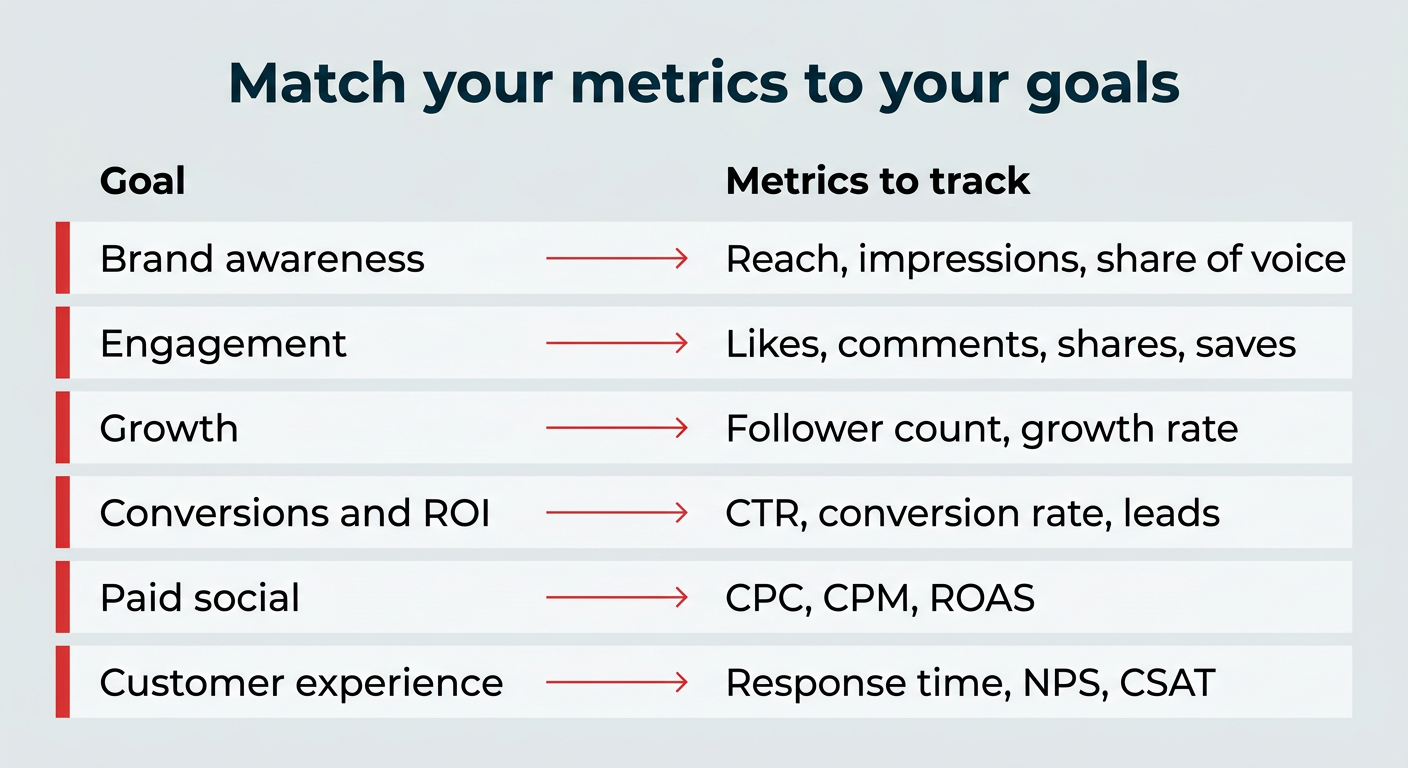
- Reach: The number of unique accounts that saw your content.
- Impressions: The total volume of times your content appeared on a screen.
- Social Share of Voice (SSoV): Your brand’s visibility compared to industry competitors.
- Social Search Visibility: How often your content appears in platform-specific search results (e.g., TikTok or YouTube search), a critical metric as younger generations increasingly bypass traditional search engines.
2. Engagement
Engagement signals how strongly your content resonates. High engagement tells the algorithm your content is valuable, which in turn fuels further reach.
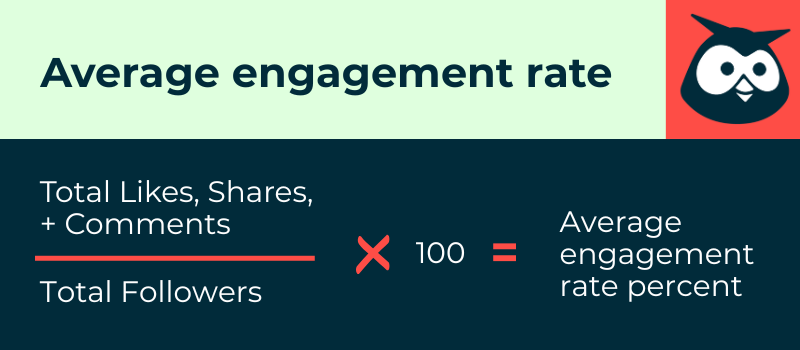
- Engagement Rate: Calculated as (Total interactions / Total followers) x 100. It is the gold standard for measuring resonance.
- Likes and Reactions: Basic signals of approval that help gauge sentiment.
- Comments: A high-intent signal that indicates your content sparked a thought or debate.
- Shares: A powerful endorsement where users pass your content to their own network.
- Saves: The ultimate "high-intent" metric. When a user bookmarks a post, they are signaling that the content holds long-term value, such as tutorials or product lists.
3. Conversion
Conversion metrics bridge the gap between social media and the company’s bottom line.
- Conversion Rate: The percentage of users who move from a social post to a desired action, such as a signup or download.
- Click-Through Rate (CTR): The frequency with which users click on your CTA. In 2026, with the decline of third-party cookies, using UTM parameters to track these clicks is essential for accurate attribution.
4. Paid Social and ROI
As paid social spend continues to capture nearly 32% of U.S. digital advertising budgets, fiscal accountability is paramount.
- Cost Per Click (CPC): Measures the efficiency of your ad spend in driving traffic.
- Cost Per Thousand Impressions (CPM): Used for awareness-heavy campaigns where volume is the goal.
- Return on Ad Spend (ROAS): The revenue generated for every dollar spent. This is the metric that leadership demands to see.
5. Audience and Customer Experience
Understanding who your audience is and how they feel about your service is the final piece of the puzzle.
- Follower Growth Rate: A measure of momentum rather than just total count.
- Sentiment Analysis: Categorizing mentions as positive, negative, or neutral.
- Average Response Time: A critical metric for customer support teams operating within social inboxes.
- CSAT and NPS: Surveys that track customer satisfaction and brand loyalty.
Implications: The Pitfalls of Platform-Specific Definitions
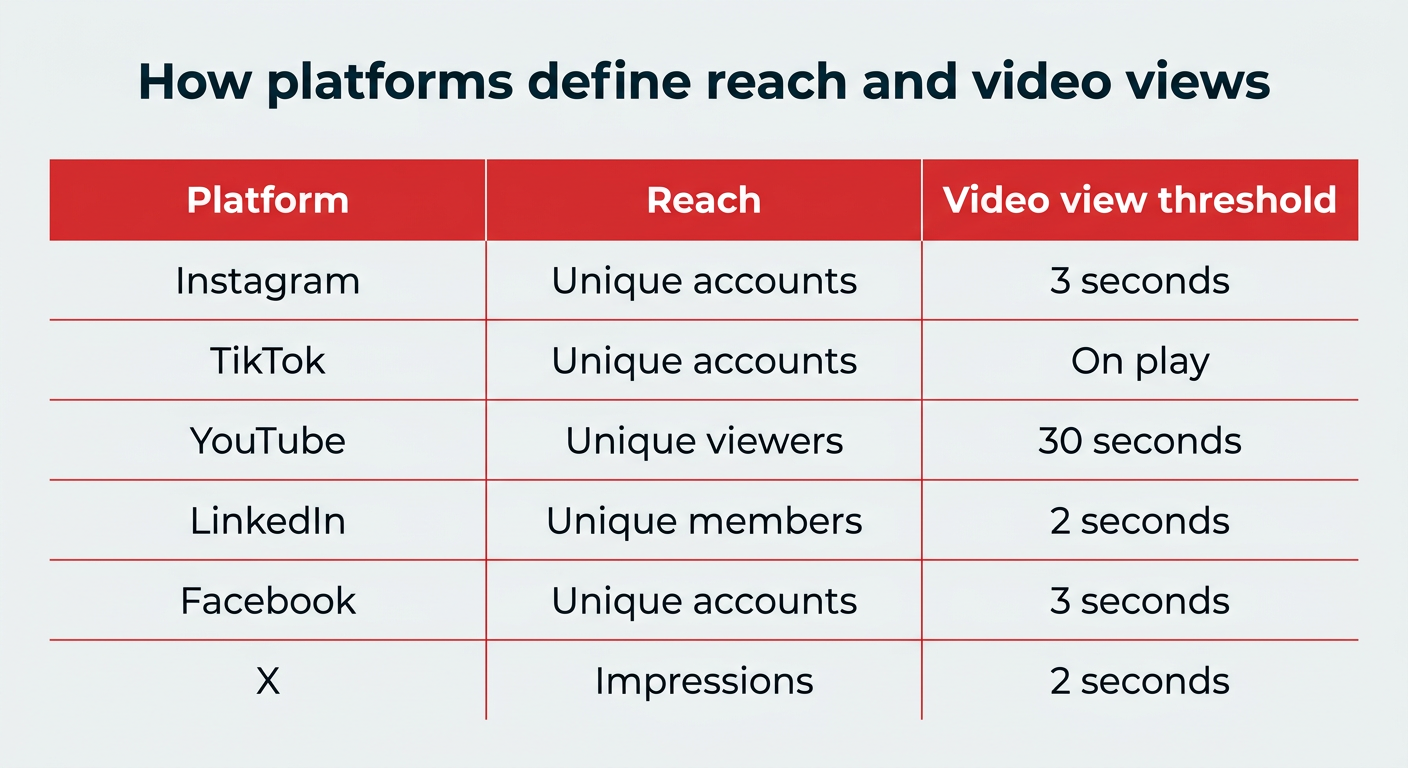
A major challenge for 2026 marketers is that the same metric can mean vastly different things across platforms. For instance, a "view" on YouTube requires 30 seconds of watch time, whereas on TikTok, it is counted as soon as the video begins. Similarly, LinkedIn calculates reach based on unique members, while Instagram focuses on unique accounts.
If you attempt to aggregate these numbers without normalizing them, you will draw erroneous conclusions. Always confirm how a platform defines a metric before benchmarking. Failure to do so can lead to an inflated sense of success or an unnecessary panic over perceived drops in performance.
Supporting Data: Why "Saves" and "Shares" Matter More Than Ever
Data from the 2025-2026 marketing cycles indicate a shift in algorithm priorities. While vanity metrics like "likes" have plateaued in their importance, "save rate" and "share rate" have emerged as the primary signals for high-quality content.
According to industry reports, a high save rate directly correlates with increased algorithmic distribution. When a user saves a post, the platform interprets this as "high value" content, subsequently pushing that post to a wider, non-follower audience. This highlights the importance of creating "saveable" content—infographics, checklists, and deep-dive educational videos—over purely aesthetic or ephemeral content.
Official Perspective: The CMO’s Priority
In a recent address regarding CMO priorities for 2026, industry experts at Gartner emphasized that marketing budgets are increasingly tied to "demonstrable revenue contribution." This has shifted the social media manager’s role from a creative role to a hybrid creative-analyst role.
"The era of ‘brand awareness’ as a catch-all excuse for lack of ROI is over," says Chloe West, a lead analyst in digital marketing. "Teams that fail to tie their social efforts to customer acquisition costs (CAC) or customer lifetime value (CLV) are finding their budgets cut in favor of performance-based channels."

Strategic Recommendations: Turning Data into Action
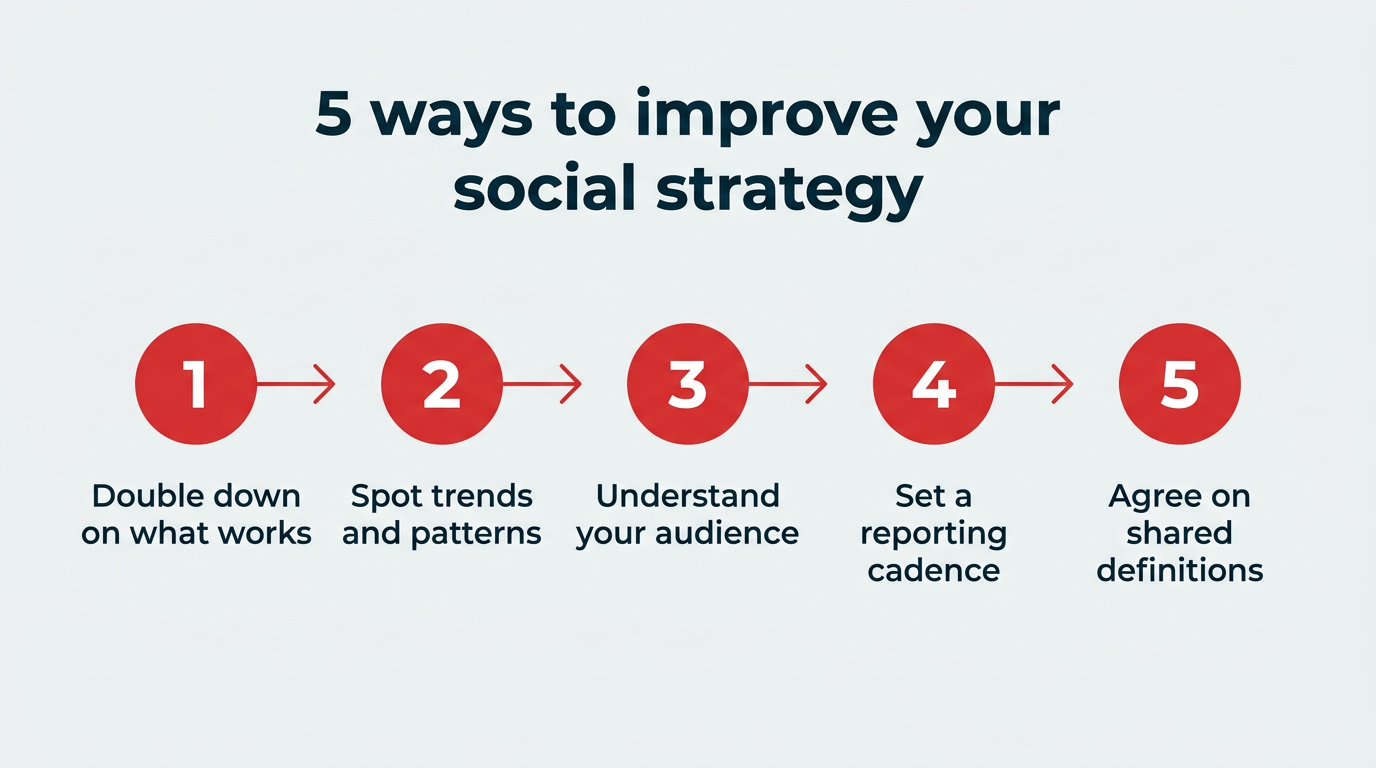
To successfully implement this framework, organizations should follow these five operational steps:
- Standardize Definitions: Ensure every team member, from the intern to the VP, uses the same calculation for "Engagement Rate."
- Audit Your Stack: Utilize native analytics for initial data gathering, but integrate a unified platform (like Hootsuite) to aggregate data across channels.
- Establish a Baseline: Before chasing growth, measure your current averages for the last 90 days. You cannot improve what you haven’t measured.
- Create a Feedback Loop: Use your monthly analytics reports to inform the next month’s content calendar. If "Saves" are up on educational content, increase your educational output by 15%.
- Focus on the Funnel: Ensure every piece of content has a purpose. If it doesn’t drive awareness, engagement, or conversion, consider whether it belongs in your strategy at all.
As we look toward the remainder of 2026, the brands that win will be those that treat social media not as a megaphone for announcements, but as a sophisticated laboratory. By meticulously tracking these 25 metrics, marketers can prove the value of their work, secure their budgets, and build a sustainable, high-performing digital presence.
