
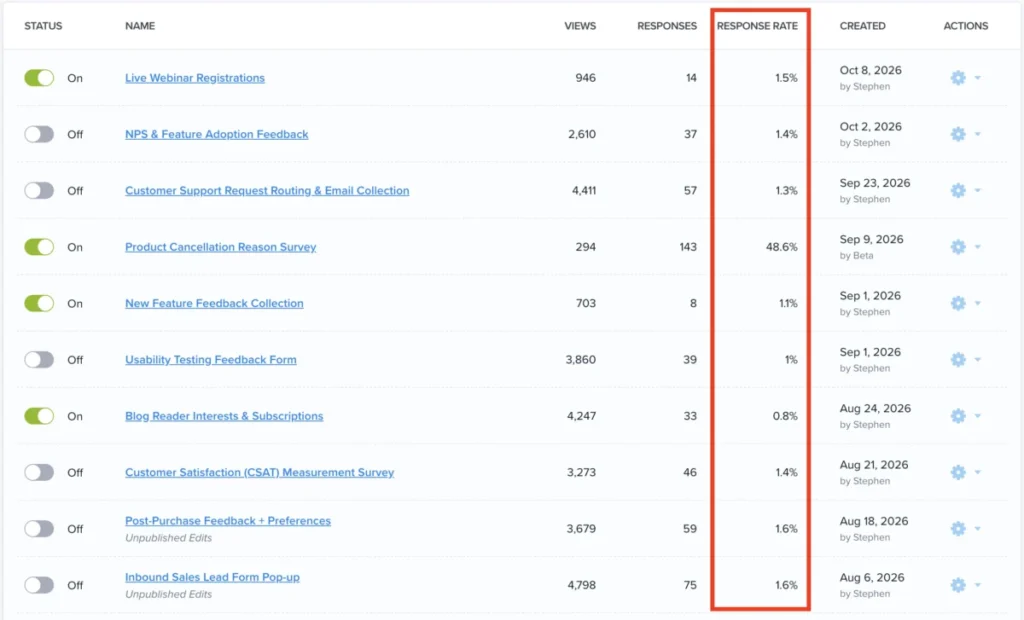
Enhancing Conversion Intelligence: Crazy Egg Unveils New Engagement Rate Analytics for Surveys and CTAs
By: Editorial Staff
October 9, 2026
In the rapidly evolving landscape of digital experience optimization, the ability to interpret user behavior in real-time has transitioned from a competitive advantage to a baseline necessity. On October 9, 2026, Crazy Egg, a leader in website optimization and heatmapping technology, announced a significant update to its platform. By introducing granular engagement rate metrics for its suite of Popup Surveys and Call-to-Action (CTA) widgets, the company is providing marketers and product managers with a more sophisticated lens through which to view user interaction.
This update represents a strategic pivot from tracking raw volume—such as total views or clicks—to understanding the efficiency of conversion funnels. By focusing on the percentage of users who actively engage with on-page elements, Crazy Egg is empowering businesses to iterate faster and make data-driven decisions that minimize user friction.
The Core Update: Moving Beyond Volume
Historically, digital analytics dashboards have been cluttered with "vanity metrics." While knowing that 5,000 users viewed a popup survey provides a sense of reach, it offers little context regarding the effectiveness of the messaging or the placement of the widget.
The new feature update in the Crazy Egg dashboard bridges this gap by calculating engagement rates automatically. Instead of forcing analysts to export data into spreadsheets to calculate conversion percentages manually, the platform now displays these ratios directly alongside traditional volume metrics. This allows for an immediate, side-by-side comparison of performance across different campaign variations.
Key Metrics Now Streamlined:
- Views vs. Response Rates: Identifying exactly how many people see a survey versus how many choose to contribute feedback.
- Impression vs. Click-Through Rates (CTR): Understanding the magnetism of CTA copy and design.
- Conversion Efficiency: Measuring the percentage of users who complete a desired action after interacting with an overlay.
A Chronology of Conversion Optimization
The release of these metrics follows a multi-year trajectory in the optimization industry, moving toward "Zero-Party Data" collection.
- Early 2024: The market saw a shift away from third-party cookies, forcing companies to rely more heavily on direct user interactions—such as surveys—to understand customer personas.
- Late 2025: Crazy Egg began expanding its widget ecosystem, allowing users to deploy customized popups without coding knowledge. The focus was on "low-disruption" engagement.
- October 2026: The current update serves as the "Optimization Layer." Having given users the tools to deploy content, the company has now provided the necessary intelligence to refine that content.
By focusing on the "engagement rate," the platform effectively acknowledges that more traffic does not always lead to better outcomes. In many cases, a high-traffic popup with a low conversion rate is a signal of "ad blindness" or poor user experience (UX) design. This update provides the diagnostic tools required to rectify these issues.
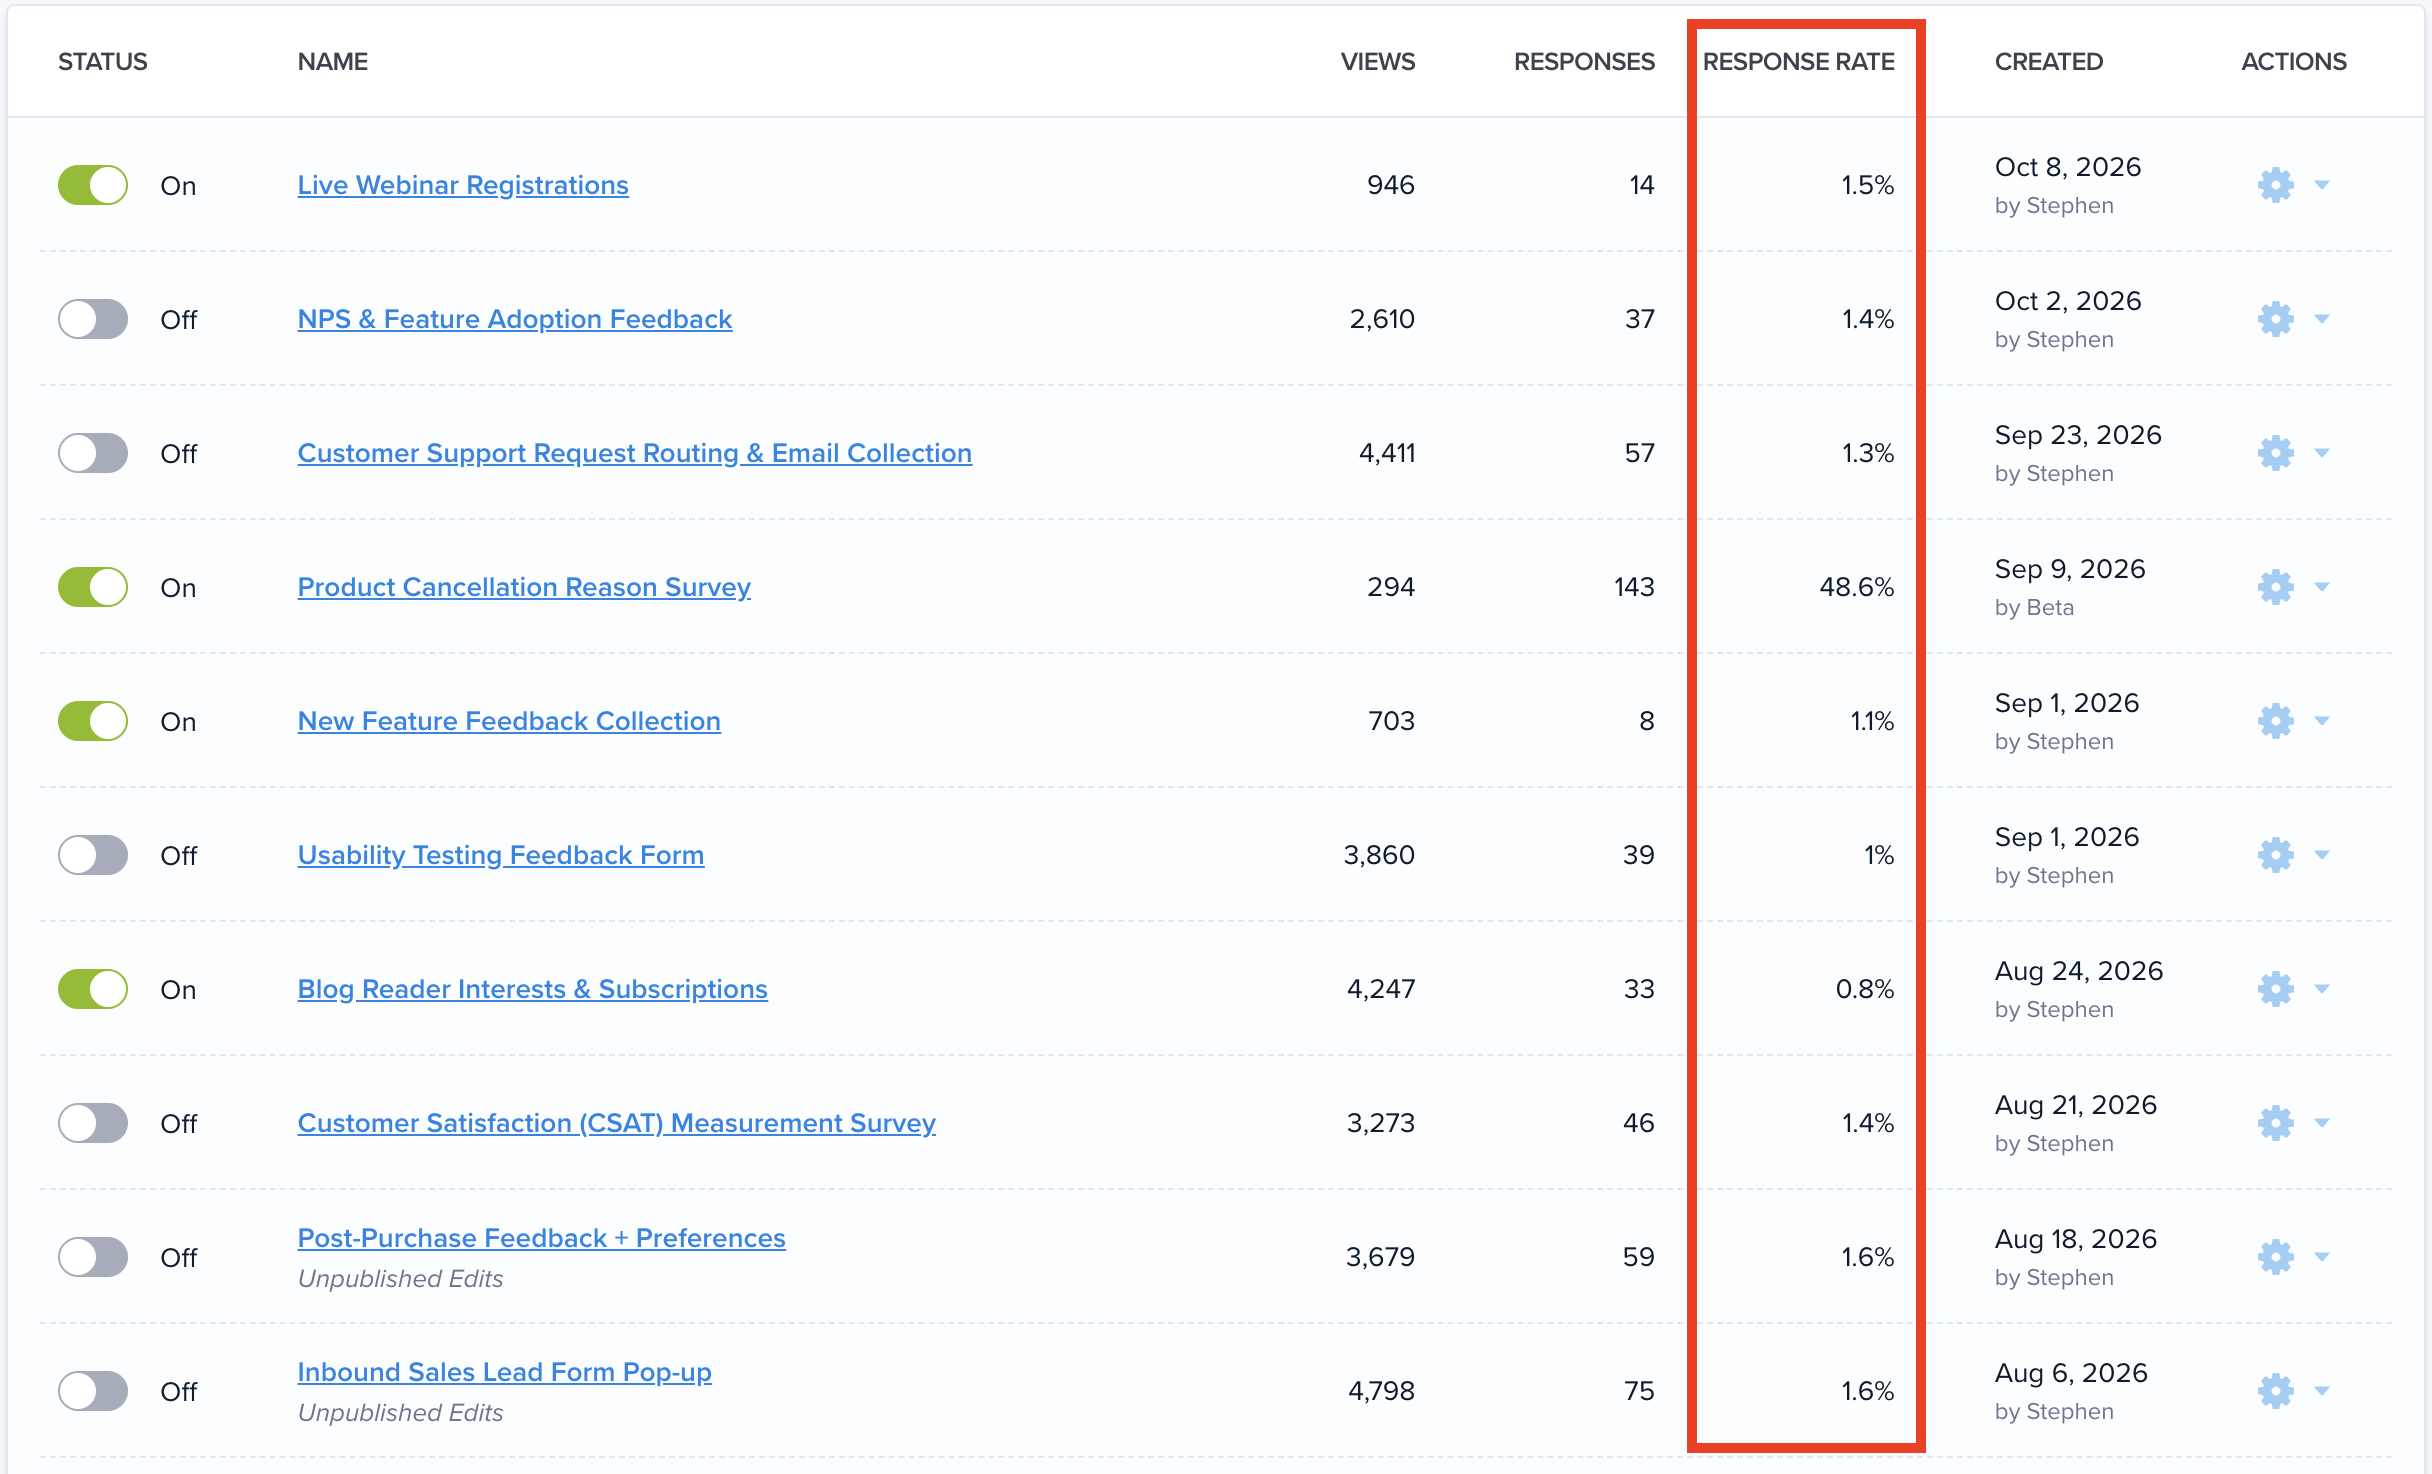
Supporting Data: Why Engagement Rates Matter
In the world of conversion rate optimization (CRO), the difference between a 2% conversion rate and a 4% conversion rate is often the difference between a failing campaign and a profitable one.
According to internal benchmarks provided by the Crazy Egg product team, the integration of engagement metrics helps teams identify three primary areas of friction:
- The "Interruptive" Penalty: High-traffic popups that see a sharp decline in overall site dwell time are often identified as "annoyance traps." By tracking engagement rates, managers can see if a popup is driving a response or simply driving the user to exit the page entirely.
- Messaging Mismatch: By A/B testing two different headlines for the same CTA, the new dashboard allows for an immediate comparison of which offer resonates more deeply with the specific segment viewing the page.
- The "Fold" Factor: Engagement rates help clarify if a CTA is being placed in a "dead zone" of a page where users scroll past without noticing the widget.
Data transparency is the cornerstone of this update. When teams can see the exact conversion percentage, they are less likely to rely on intuition and more likely to rely on the "truth" of the user journey.
Industry Implications and Expert Commentary
Stephen Ngo, Director of Growth Marketing at Crazy Egg, has emphasized that this update is part of a broader vision to democratize data analytics for non-technical users. "The goal is to eliminate the ‘black box’ of conversion data," says Ngo. "By showing engagement rates, we are helping our users see the efficiency of their site, not just the noise of their site traffic."
From an industry perspective, this move aligns with a broader trend of "Platform Simplification." As marketing stacks become more complex, tools that provide actionable insights without requiring a data science degree are gaining significant market share.
Impact on Marketing Strategy:
- Iterative Testing: The barrier to entry for A/B testing is significantly lowered when the success metrics are presented in a clear, comparative dashboard.
- Budget Allocation: Marketing teams can now justify spend on specific campaigns by demonstrating that a 5% engagement rate on a popup is more valuable than a 1% engagement rate on a banner ad.
- UX Design: Designers can now prove that specific UI choices—such as button color, text size, or animation—directly correlate to higher engagement.
Optimizing the User Experience (UX)
While the technical update focuses on numbers, the broader implication is on the human experience of the web. Too often, popups are treated as an afterthought—clunky, intrusive, and irrelevant.
By prioritizing engagement metrics, Crazy Egg is nudging its users toward a more "user-centric" design philosophy. If a survey has a consistently low engagement rate, it is a clear indicator that the content is either poorly timed or irrelevant to the visitor. This forces the user to improve the quality of their interactions rather than simply increasing the frequency of them.

The dashboard serves as a mirror; if the engagement rate is low, the business is forced to ask, "Why isn’t the user finding value in this interaction?" This cycle of inquiry is exactly what leads to better, more empathetic digital experiences.
Conclusion: The Path Forward
As we move into 2027, the focus for digital marketing will undoubtedly remain on efficiency. With the introduction of these new engagement rate analytics, Crazy Egg has set a standard for how SaaS platforms should empower their customers.
The ability to compare Popup Surveys and CTAs side-by-side, armed with clear conversion percentages, allows for a more scientific approach to website management. Whether you are a small business owner looking to capture more leads or a growth marketer managing a complex conversion funnel, these tools provide the clarity needed to cut through the digital clutter.
For current Crazy Egg users, the new dashboard metrics are available immediately. The recommendation is to begin by auditing existing active campaigns—identify those with the highest volume but lowest engagement—and begin the iterative testing process to bring those metrics in line with industry best practices.
In the final analysis, data is only as good as the action it inspires. By making the metrics of engagement transparent, accessible, and comparable, Crazy Egg has provided a roadmap for businesses to not only grow their traffic but to truly understand the people behind the clicks.
Disclosure: This content is reader-supported, and we may earn commissions from links related to Crazy Egg. Our editorial team remains independent, and these commissions do not influence our assessment of the platform’s features or capabilities.
