

Decoding Success: The 10 Essential Metrics for High-Performing Landing Pages
Last Modified: March 19, 2025
In the modern digital economy, a website is far more than a collection of pages—it is your storefront. Just as a physical shop window dictates whether a passerby becomes a customer or keeps walking, your landing page serves as the critical "first impression" interface. If a visitor finds the experience lacking, they don’t just walk away; they often leave your ecosystem entirely, potentially moving to a competitor.
With digital marketers investing substantial portions of their budgets into paid advertising, social media campaigns, and rigorous SEO strategies to drive traffic, the landing page is where the return on investment (ROI) is won or lost. Understanding how to measure performance is no longer optional; it is the cornerstone of sustainable growth.
This guide explores the top 10 landing page metrics every marketer must track to turn passive visitors into active conversions, regardless of the analytics platform in use.
1. Traffic Sources: The Contextual Foundation
While technically a dimension rather than a performance metric, traffic sources are the lens through which all other data must be viewed. You cannot optimize a landing page in a vacuum.

By segmenting your data by traffic source—such as Paid Search, Paid Social, Organic Search, or Email—you gain a granular understanding of channel effectiveness. For example, if your Paid Search campaigns exhibit a high bounce rate while your Paid Social traffic leads to consistent conversions, the issue likely isn’t the landing page itself, but the intent alignment between your ad copy and the page content. This insight allows for the strategic reallocation of budgets toward high-performing channels and identifies specific campaigns that require optimization.
2. Conversion Rate (CR): The North Star Metric
The primary objective of most landing pages is to facilitate a specific action—whether that is a newsletter sign-up, a product purchase, or a whitepaper download. The conversion rate (CR) is the definitive measure of this effectiveness.
The Formula: (Total Conversions / Total Visitors) 100*
To derive actionable insights, you must look beyond the aggregate. Benchmark your performance against industry standards, while keeping in mind that nuances like geographic location, price point, and industry (B2B vs. B2C) will heavily influence your results. Using platforms like GA4, marketers can track session and "key event" rates to determine which segments—such as first-time versus returning visitors—are driving the most value.
3. Bounce Rate: The Pulse of Engagement
Bounce rate measures the percentage of visitors who arrive at your landing page and depart without performing an interaction. A high bounce rate often signals a mismatch between user expectations and the landing page experience.
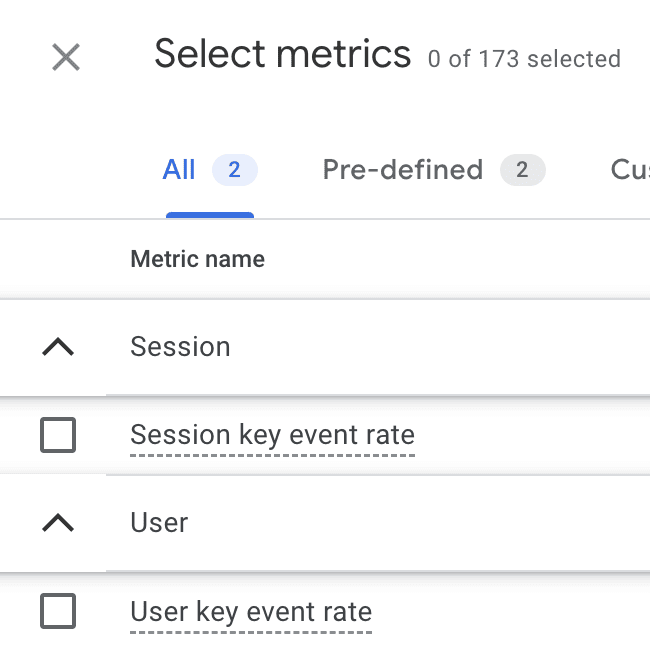
The Formula: (Sessions with one page / Total Sessions) 100*
While a 100% bounce rate is a red flag, a 0% bounce rate can sometimes indicate broken tracking. According to industry data from HubSpot, a healthy bounce rate typically ranges between 26% and 70%. Context is king: blog posts naturally have higher bounce rates, whereas high-intent product pages should ideally see lower ones. If your bounce rate is suspiciously low (below 20%), investigate your tracking implementation to ensure you aren’t capturing "false positives."
4. Average Time on Page: Gauging Depth of Interest
Time on page serves as a proxy for engagement. However, interpreting this metric requires an understanding of your business model.
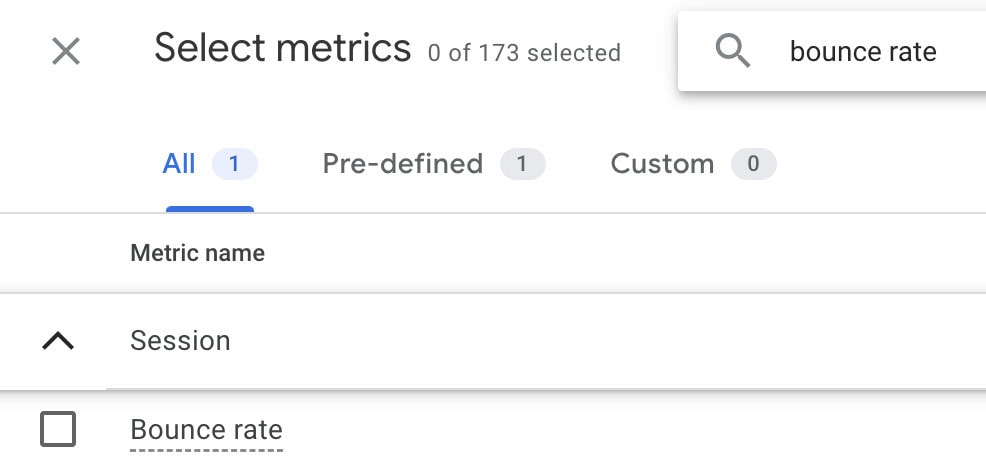
For high-value, complex B2B services, a longer dwell time suggests that the visitor is actively researching and digesting your value proposition. Conversely, for a simple lead-gen page designed for speed, a high dwell time might indicate confusion or a broken call-to-action (CTA). In GA4, focus on "Average Engagement Time" to filter out sessions where the user merely left the tab open in the background, providing a more accurate reflection of actual attention.
5. Form Abandonment Rate: Identifying Friction
For lead-generation pages, the form is the final hurdle. If users arrive at your form but fail to hit "submit," you are losing leads at the bottom of the funnel.
The Formula: (Form Started – Form Completed) / Form Started 100*
High abandonment rates usually point to "form friction." Are there too many fields? Is the language confusing? Does the form fail to render correctly on mobile devices? By calculating this rate, you can justify A/B testing shorter forms or social-login integrations to streamline the user journey.
6. Cost Per Conversion: The Financial Reality
When your traffic is paid for, every click represents a line item on your budget. The cost per conversion (CPC) provides the ultimate measure of efficiency for your advertising spend.
The Formula: Marketing Cost ($) / Total Conversions
If your cost per conversion exceeds the lifetime value (LTV) or profit margin of the customer acquired, your current strategy is unsustainable. This metric forces a hard look at the landing page’s ability to convert and the quality of the traffic being sent to it.
7. Exit Rate: Beyond the Bounce
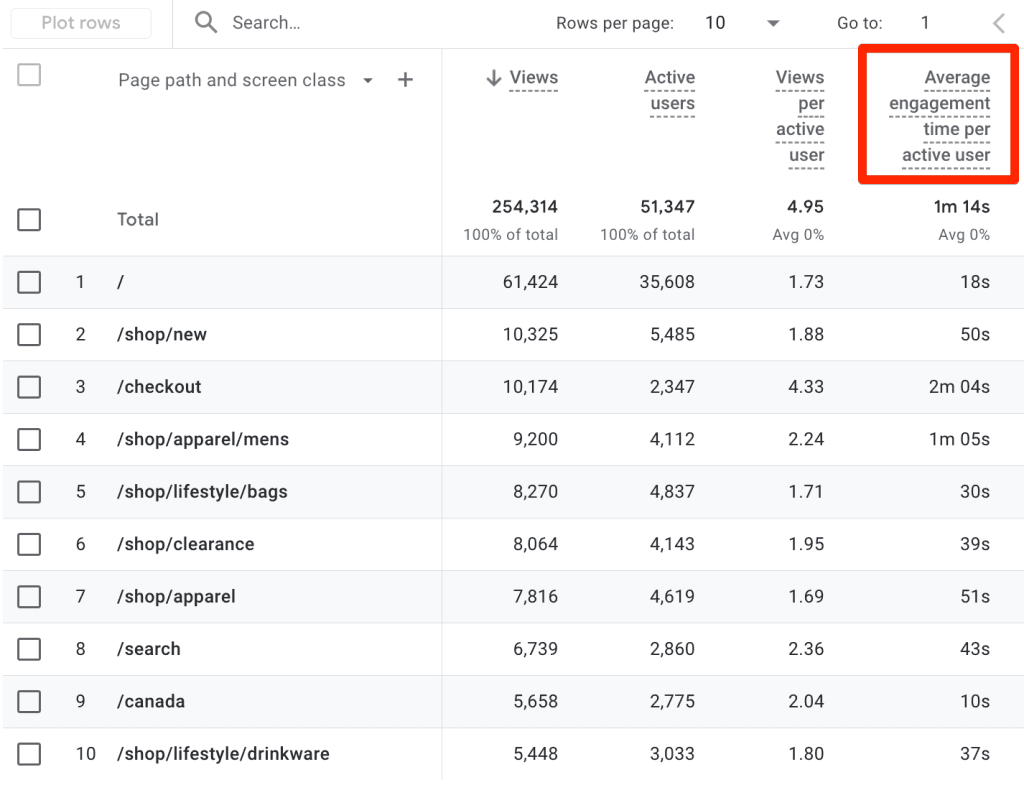
It is common to confuse bounce rate with exit rate, but the distinction is vital. A bounce occurs when a visitor leaves from the entry page. An exit rate refers to the percentage of visitors who leave your site from a specific page after visiting other pages.
If a landing page has a high exit rate, it suggests that even if users initially engaged, the page failed to keep them moving further down the sales funnel. This indicates a potential failure in internal linking, navigation, or the "next step" call-to-action.
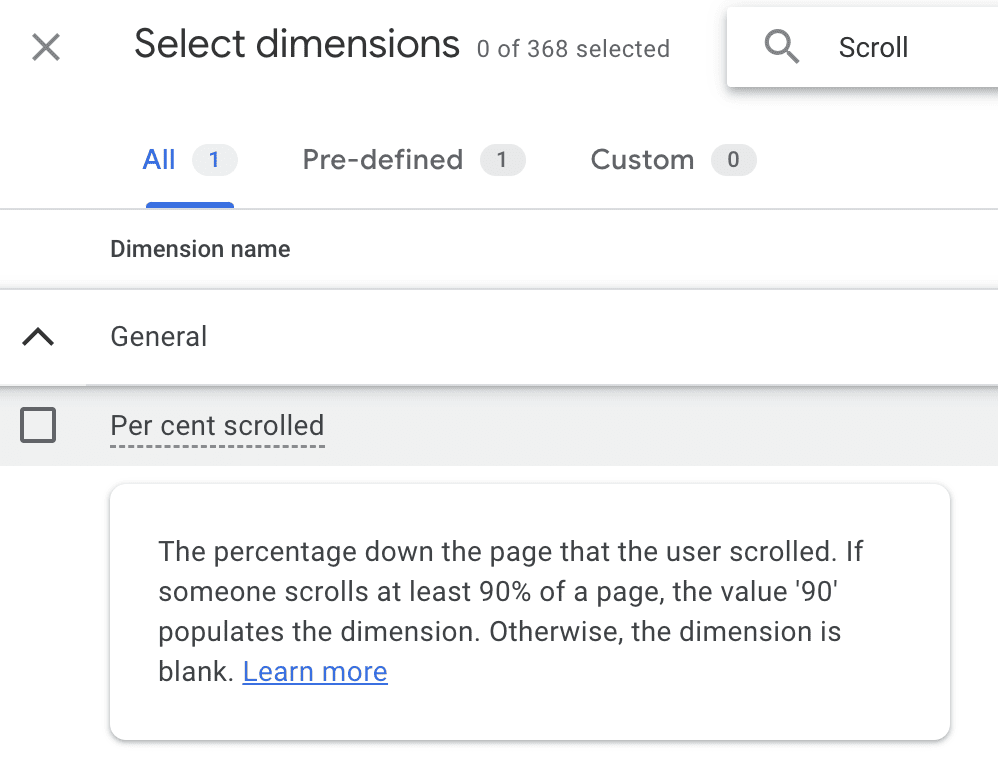
8. Scroll Depth: Measuring Visibility
Not all content on a landing page is created equal. Scroll depth helps you determine whether your most critical assets—such as testimonials, security badges, or the final CTA—are actually being seen.
In GA4, scroll depth is typically tracked as a dimension. If your analytics show that 90% of your users drop off before reaching the 50% scroll mark, you have hard evidence that your key value proposition must be moved "above the fold."
9. Click-Through Rate (CTR)
CTR measures the effectiveness of individual elements on your page, such as buttons, banners, or links.
The Formula: (Total Clicks / Total Impressions) 100*
If your page has high traffic but low conversions, check the CTR of your primary CTAs. A low CTR suggests that the button copy, design, or placement is failing to command attention. Conversely, a high CTR coupled with low final conversions suggests the issue lies in the destination page (e.g., the landing page you are pointing to is not meeting the promise made by the button).
10. New vs. Returning Visitors: The Relationship Lifecycle
Analyzing the behavior of new versus returning visitors provides a macro view of your brand’s "stickiness." Returning visitors who bounce at a high rate may indicate that your retargeting ads are failing to provide fresh value or that the visitor has already decided against your product. Combining this metric with others, such as conversion rate, allows you to see if your landing page is better suited for customer acquisition or customer retention.
Implications and Strategic Optimization
Data, while powerful, is only as good as the action it inspires. The "what" (the numbers) must always be supplemented with the "why" (the behavior).
The Chronology of Optimization:
- Initial Baseline: Establish your current performance metrics for each of the 10 categories.
- Behavioral Overlay: Use heatmaps (such as Hotjar or Clarity) and session recordings to observe how users interact with your page elements.
- Hypothesis Testing: Identify a specific metric that is underperforming and create an A/B test to address it (e.g., shortening a form to reduce abandonment).
- Validation: Review the data post-implementation to verify if the change resulted in a statistically significant improvement.
Official Perspectives on Analytics
Leading industry analysts emphasize that modern web analytics are shifting away from vanity metrics toward behavioral intent. Google Analytics 4 (GA4), in particular, has moved toward event-based tracking, allowing for more precise measurement of user journeys across devices. By utilizing Explorations and custom reporting, businesses can now map the specific paths taken by high-converting users, allowing for the replication of successful patterns.
Conclusion
Optimizing landing pages is a continuous loop of testing, measuring, and refining. While these 10 metrics provide the framework, the ultimate goal is to remove friction from the user experience. By integrating quantitative data from your analytics platform with qualitative insights from user testing and session recordings, you create a robust, data-driven culture that transforms your landing pages into high-converting assets.
The question for your marketing team is no longer "is the traffic high enough," but "are we providing the seamless experience our users demand?" The answer lies in the data.
