

Beyond the Click: The Ultimate Guide to Landing Page Analytics in 2025
Last Modified on March 19, 2025
In the modern digital economy, a website acts as your global storefront. If your website is the shop itself, then your landing pages are the window displays—they are the first point of contact between your brand and a potential customer. Much like a physical store window, a landing page’s design, messaging, and functionality determine whether a visitor walks through the door or continues down the street to a competitor.
Because a landing page is often the inaugural experience for a user, it carries a heavy burden: it must capture attention, build trust, and drive action in seconds. With digital marketers pouring significant portions of their budgets into paid advertising and search engine optimization (SEO) to drive traffic to these specific pages, the stakes have never been higher. Failure to optimize these pages doesn’t just lead to a poor user experience; it leads to wasted marketing spend and lost revenue.
To maximize your return on investment (ROI), you must look beyond surface-level vanity metrics. This guide outlines the top 10 landing page metrics you need to track to understand user intent, identify friction points, and optimize your performance.
1. Traffic Sources: The Contextual Foundation
While not a performance metric in the traditional sense, understanding your Traffic Sources is the prerequisite for all analytical work. Without knowing where your visitors originate, you cannot effectively attribute success or diagnose failure.
By segmenting your data by traffic source—such as Paid Search, Paid Social, Organic Search, or Email—you can uncover critical discrepancies. For instance, if your Paid Search campaigns yield a significantly lower conversion rate compared to Paid Social despite having a higher cost-per-click, you gain an immediate, actionable insight: it is time to reallocate your budget.

Analyzing traffic sources allows you to treat your landing page as a dynamic environment rather than a static asset. It tells you who is visiting and why, allowing you to tailor the page experience to the expectations set by the original ad or link.
2. Conversion Rate (CR)
The Conversion Rate (CR) is the North Star of landing page performance. It quantifies the effectiveness of your page in compelling users to take a desired action, whether that is submitting a lead-generation form, signing up for a newsletter, or completing a purchase.
The Formula: (Total Conversions / Total Visitors) * 100 = CR%
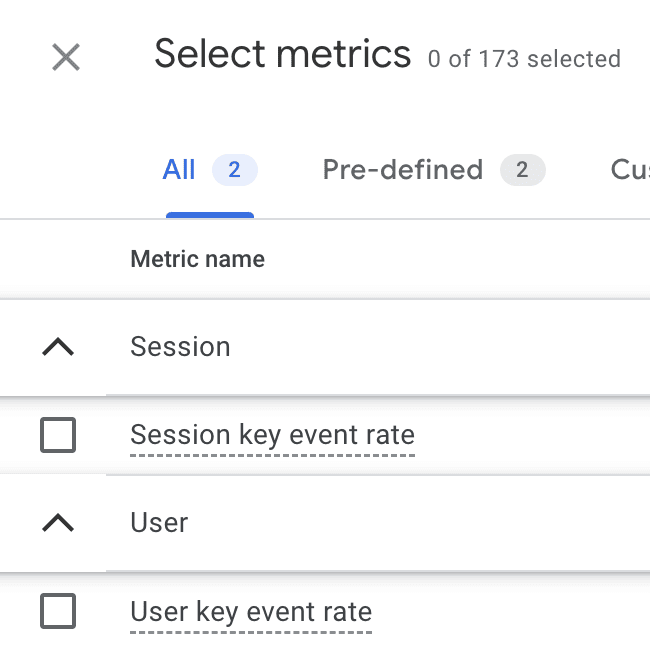
To master this metric, you must move beyond the aggregate. Break down your conversion rate by device, traffic source, and user demographic. Additionally, benchmarking your CR against industry standards is essential. However, keep in mind that "industry averages" are merely guidelines; your specific business model, product price point, and geographic location will introduce unique variables. If you are using Google Analytics 4 (GA4), keep a close eye on your "Key Event Rates," which provide a granular view of how effectively your page triggers specific business goals.
3. Bounce Rate: Measuring Immediate Disengagement
A high Bounce Rate is often the first warning sign that your landing page is failing to meet user expectations. A "bounce" occurs when a user lands on your page and exits without interacting or navigating further into your site.
The Formula: (Sessions with one page / Total Sessions) * 100 = Bounce Rate%
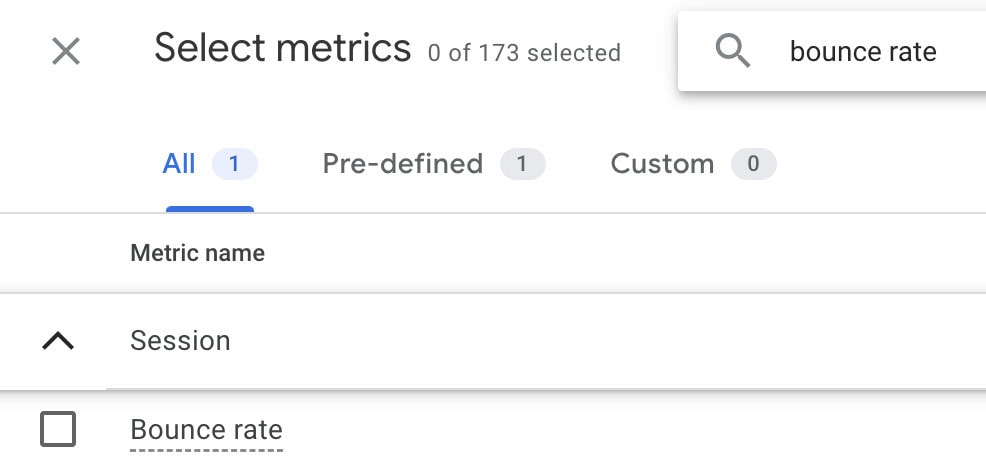
While a bounce rate between 26% and 70% is common across industries, context is everything. Blog pages naturally see higher bounce rates as readers consume the content and leave. However, if your product page has a bounce rate exceeding 80%, it may indicate slow page load times, irrelevant ad messaging, or a layout that is visually overwhelming. Use GA4’s "Explorations" feature to monitor this metric, as it provides the most flexibility for identifying pages that are driving users away prematurely.
4. Average Time on Page
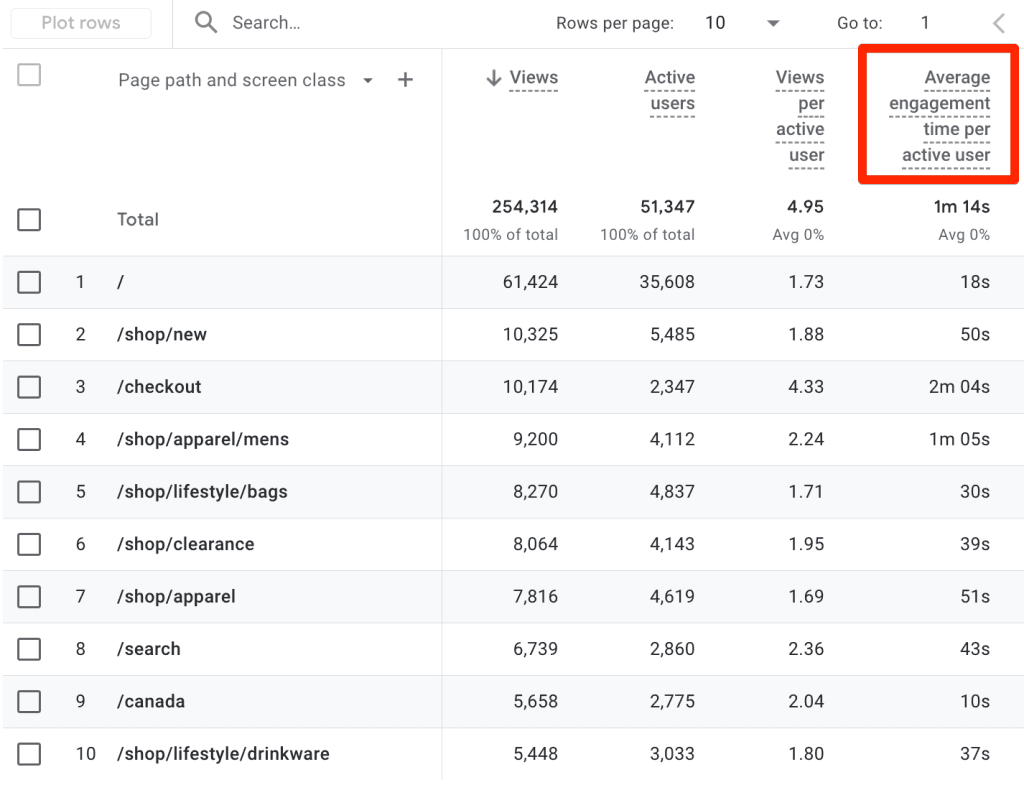
Average Time on Page provides a window into the depth of user engagement. Does this metric signal success or failure? The answer depends entirely on your goal.
- High Engagement: If you are selling a complex, high-value B2B software, a long time on page suggests users are reading your documentation and understanding your value proposition.
- Low Engagement: If your landing page is designed for a quick, simple action (like a "Download Now" button), a long time on page might actually indicate that the user is lost or confused.
When users spend very little time on a page that requires a long read, it signals a disconnect. When they spend too much time on a simple form, it signals technical friction. Always balance this metric against the complexity of your content.
5. Form Abandonment Rate: Identifying Friction
For marketers, the form is the most critical hurdle. The Form Abandonment Rate tells you exactly how many people started the journey but dropped out before the finish line.
The Formula: (Form Started – Form Completed) / Form Started * 100
If your abandonment rate is high, it is a direct signal that your form is too long, asks for invasive information, or contains technical bugs. By simplifying form fields or implementing auto-fill features, you can often see an immediate lift in conversions. If you have custom tracking set up in GA4, you can monitor this at the event level to pinpoint which specific field causes users to lose interest.
6. Cost Per Conversion
In a performance-marketing-driven world, Cost Per Conversion is the ultimate metric for financial health.
The Formula: Marketing Cost ($) / Number of Conversions
If you are spending $2,500 on an ad campaign and generating 121 conversions, your cost per conversion is roughly $20.67. The objective is simple: ensure that the value of the conversion (the customer lifetime value or immediate sale) significantly outweighs this cost. If your cost per conversion is creeping upward, it is time to audit your ad targeting or refine your landing page messaging to improve quality scores.
7. Exit Rate
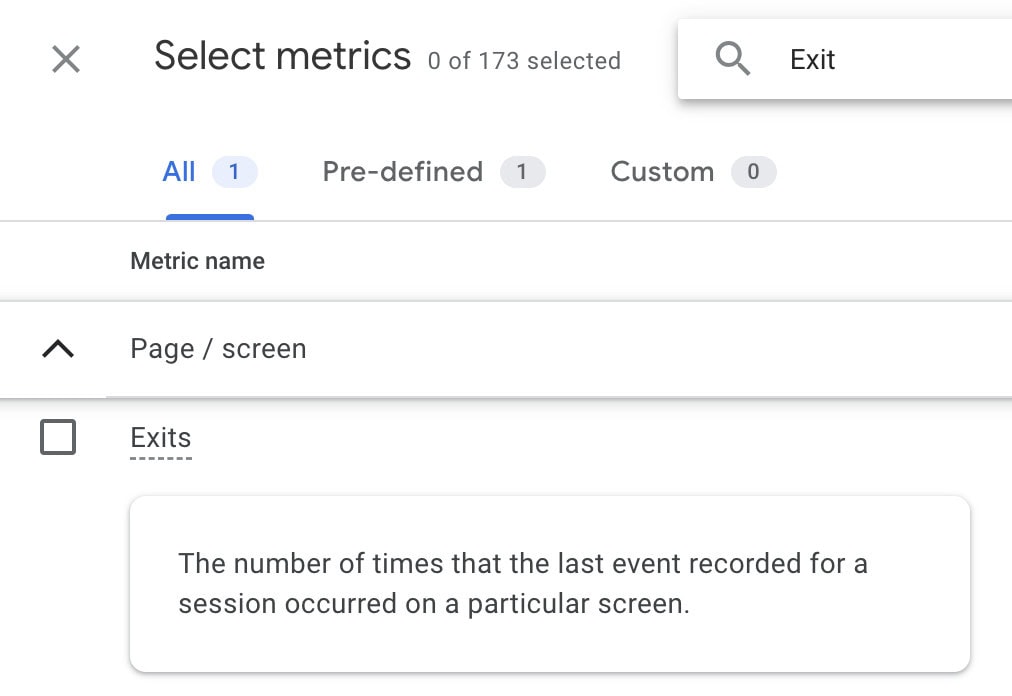
Often confused with bounce rate, the Exit Rate is distinct. While bounce rate focuses on single-page sessions, exit rate identifies the final page a user visits before leaving your site, regardless of how many pages they viewed beforehand.
The Formula: Number of Exits / Total Pageviews * 100
If a user visits your landing page, moves to a pricing page, and then leaves, that counts as an exit from the pricing page, not a bounce from the landing page. By monitoring exit rates, you can determine if your landing page is successfully guiding users further into the sales funnel or if it acts as a "dead end."
8. Scroll Depth
Scroll Depth is an essential behavioral metric for long-form landing pages. It tracks how far down the page a visitor travels, typically reported in percentages (25%, 50%, 75%, 100%).
If your critical Call-to-Action (CTA) is placed at the bottom of a page, but your scroll depth data shows that only 10% of users make it that far, you have an urgent design problem. Use this metric to strategically place your most important information, testimonials, and trust badges in the "prime real estate" of the user’s scrolling path.
9. Click-Through Rate (CTR)
The Click-Through Rate (CTR) of your on-page elements—such as buttons, links, or pop-ups—is the litmus test for your design and copy.
The Formula: (Total Clicks / Total Impressions) * 100
A high CTR indicates that your copy is compelling and your visual hierarchy is working. A low CTR, however, suggests that your buttons are not standing out, the offer is not perceived as valuable, or there is a lack of trust in the page design. A sudden, unexpected drop in CTR is often a "canary in the coal mine" for broken links or misaligned mobile responsiveness.
10. New vs. Returning Visitors
Analyzing the behavior of New vs. Returning Visitors allows you to tailor your strategy to different stages of the buyer’s journey.
New visitors need education and clarity to build immediate trust. Returning visitors, however, have already been introduced to your brand; they may need a different type of incentive, such as a limited-time offer or a case study, to push them over the line. By segmenting your conversion and bounce rates by visitor type, you can craft a more personalized experience that addresses the specific psychological needs of each group.
The Path to Optimization
Tracking these 10 metrics is only the beginning. To truly understand the "why" behind the numbers, you must integrate your quantitative analytics with qualitative tools.
Complementary Behavioral Analysis
While GA4 and other analytics suites provide the "what," behavioral tools provide the "how." By utilizing heatmaps and session recordings (via platforms like Hotjar or Clarity), you can watch how real users interact with your pages.
- Heatmaps: Reveal where users are clicking and how far they are scrolling.
- Session Recordings: Show you exactly where users hesitate, where they rage-click, and where they abandon the page.
- User Testing: Conducting custom interviews or exit-intent surveys can provide direct feedback on why a user chose not to convert.
Implications for Future Strategy
The modern marketer must move toward a culture of experimentation. Once you have identified a problem through your metrics, you should initiate A/B testing to validate potential solutions. Whether it is changing a CTA color, shortening a form, or re-writing a headline, every change should be measured against the benchmarks you have established.
Ultimately, your landing page is a living document. It is not something you "set and forget." By consistently auditing your traffic sources, conversion rates, and engagement metrics, you ensure that every dollar spent on marketing is working to build a more profitable and user-centric digital experience.
As you refine your approach, keep the conversation going with your marketing team. The most successful landing pages are the result of constant collaboration between data analysts, UX designers, and copywriters—all working in harmony to transform clicks into loyal customers.
