Beyond Correlation: How Causality Reporting is Transforming Strategic Business Intelligence
In the modern corporate landscape, executives are often haunted by two pervasive questions: "Did that high-stakes exhibition actually move the needle?" and "Was that aggressive PR push merely expensive noise, or did it fundamentally alter our market trajectory?"
For years, marketing and operations have existed in silos, leaving C-suite leaders to rely on gut instinct or fragmented dashboards to evaluate the return on investment for real-world initiatives. Today, that uncertainty is being dismantled by the emergence of the Causality Report—a sophisticated analytical framework designed to bridge the gap between offline business events and digital performance metrics. By mapping physical-world actions against digital KPIs, organizations are finally gaining the "evidence-based" visibility required to make smarter, data-driven decisions.
The Core Concept: What is a Causality Report?
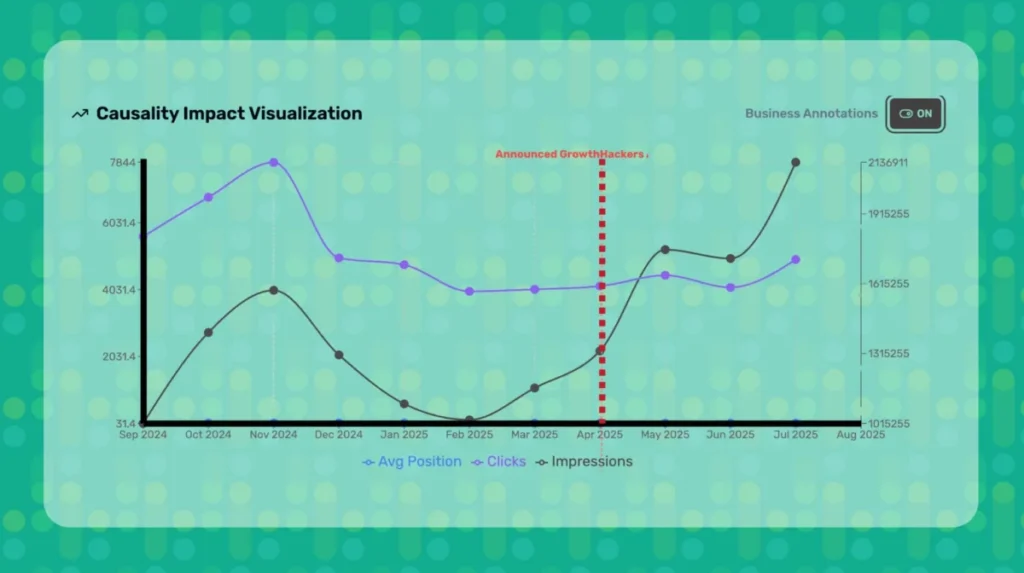
At its simplest, a Causality Report is a diagnostic tool that visualizes the "before-and-after" impact of specific, time-bound business events. Unlike standard analytics reports that track trends in a vacuum, a causality report mandates a deliberate annotation of an event—such as a product launch, a trade show, a retail store opening, or a targeted press release.
By pinning these events to a specific date—for example, April 2025—analysts can observe how key metrics, such as website traffic, impression share, click-through rates, and conversion volume, evolve in the immediate aftermath. This process shifts the focus from mere correlation—where one might guess if an event caused an increase—to evidence-based analysis. It provides the visual proof necessary to confirm that a business action was the catalyst for a shift in digital behavior.
Chronology of Impact: The Anatomy of a Pivot
To understand the power of this reporting, we must look at the chronology of a typical business intervention. In a standard data environment, a spike in website traffic might be attributed to seasonality or algorithmic luck. However, when a Causality Report is applied, the narrative changes.
Phase 1: The Baseline
Before the event, the business maintains a "steady state." By establishing a baseline, teams can identify the organic growth or decay rate of their digital performance without external interventions.
Phase 2: The Annotation (The Catalyst)
The "Business Annotations ON" toggle is activated. An event is marked. This is the crucial moment where the narrative intelligence begins. By tagging an event, the software creates a vertical marker in the data stream, essentially drawing a line in the sand between "pre-event" and "post-event" reality.
Phase 3: The Observation Window
In the period following the event (e.g., the weeks after April 2025), the data begins to tell a story. If the Causality Report shows a sustained shift in metrics—such as a 20% increase in brand-name search queries or a surge in qualified leads—the company moves from speculation to confirmation.
Phase 4: Validation
This is where "Business Intuition" is codified. By reviewing the data, stakeholders can determine if the impact was ephemeral (a short-term spike) or structural (a long-term change in baseline performance).
Supporting Data: Why Correlation is No Longer Enough
The modern enterprise generates terabytes of data, but data without context is noise. Most organizations fall into the trap of assuming that because a PR campaign happened at the same time as a traffic spike, the campaign was successful.
However, Causality Reporting demands more. By using rigorous temporal mapping, it identifies whether the traffic spike was truly an anomaly linked to the event or part of a larger, pre-existing trend.
Key indicators analyzed in these reports include:
- Impression Velocity: How quickly did the volume of brand impressions change relative to the event date?
- Conversion Lag: Did the event trigger immediate purchases, or was there a delayed reaction?
- Metric Elasticity: How sensitive were digital performance metrics to specific types of offline business actions?
When these data points are presented together, the results are undeniable. A clear shift occurring immediately after a defined business action is not a coincidence; it is a signal. It provides the "evidence" that the budget allocated to that event was not just spent, but invested.
Bridging the Silos: The Goldmine of Business Intuition
One of the most persistent issues in corporate management is the divide between "Marketing" and "Business Ops." Marketing departments are often focused on top-of-funnel metrics, while operations teams are focused on inventory, supply chains, and retail throughput.
When you connect these dots through Causality Reporting, you uncover a goldmine of strategic intelligence:
- Unified Goal Setting: When marketing and operations share the same view of "cause and effect," they can align their efforts. If a PR event causes a surge in demand, operations can use that insight to adjust supply chain logistics in real-time.
- Resource Allocation: By identifying which events have the highest "causality factor," companies can stop funding low-impact initiatives and double down on the strategies that actually move the needle.
- Narrative Intelligence: Data becomes a story. Instead of presenting a spreadsheet of numbers to the board, a leader can show a visual chart with annotated events, creating a compelling narrative of business success.
If you are not correlating your real-world business actions with digital metrics, you are leaving substantial business intelligence on the table. You are essentially flying blind, hoping that your actions are having an effect rather than knowing they are.
Practical Applications: When to Use Causality Reporting
The utility of a Causality Report is not limited to one industry or one department. It is a universal tool for any organization that wants to measure the efficacy of its strategic moves.
1. Evaluating Trade Shows and Exhibitions
Did the massive spend on that Las Vegas trade show actually result in a measurable uptick in digital inquiries? By annotating the dates of the show, you can see if the "halo effect" is real or if the traffic remained static.
2. Measuring PR Campaigns
PR is notorious for being difficult to track. By using causality reporting, you can see if a major press release leads to a sustained increase in organic search, proving the value of your PR firm’s reach.
3. Retail and Pop-up Store Openings
When opening a new physical location, causality reports can track the "digital resonance" of the opening. Does the new store drive local digital traffic? Does it increase mobile engagement in the surrounding zip codes?
4. Product Launches and Updates
For digital-first companies, the causality report is the ultimate feedback loop. Did the new feature launch in April 2025 result in increased user retention or a decrease in bounce rates?
Implications for the Future of Management
The rise of the Causality Report marks a shift toward a more mature, empirical approach to business management. In an era where "big data" is often used to overwhelm decision-makers, this tool acts as a filter, focusing attention on what matters: the link between action and outcome.
As organizations continue to adopt these frameworks, the role of the analyst will evolve. They will no longer just be "data pullers"; they will become "narrative architects." By toggling "Business Annotations ON," they transform passive, cold data into actionable business intelligence.
Furthermore, this transparency forces accountability. When every major business action is annotated and measured, it becomes difficult for departments to hide behind vanity metrics. Success is clearly defined, and failure is clearly identified. This culture of transparency is the foundation of high-performance organizations.
Final Thoughts: Moving Beyond "What Happened" to "Why It Happened"
The transition from reporting metrics to telling stories is the final hurdle for many modern businesses. A dashboard showing a line graph is just a picture of the past. A Causality Report, however, is a blueprint for the future.
It provides the intellectual foundation to justify future investments. When a CMO can look at a board of directors and point to a specific event on a chart—explaining exactly how that event triggered a transformation in customer behavior—they gain the trust and the budget to continue innovating.
The "Business Annotations" feature is more than just a UI convenience; it is a strategic layer that turns the chaos of raw data into a coherent, evidence-based business narrative. As we move further into a data-saturated decade, the ability to discern causality from coincidence will be the defining trait of the companies that lead their respective industries.
Stop guessing whether your efforts are working. Start measuring the impact of your actions, refine your intuition through data, and begin telling the story of your business growth with the authority of evidence. The causality revolution has arrived, and it is changing the way we think about the impact of every business decision, one annotation at a time.
