
Bridging the Gap: How the "Causality Report" Is Transforming Data Intelligence
In the modern enterprise, marketing and business operations have historically operated within silos. Marketing teams chase impressions, clicks, and engagement, while operational teams monitor supply chain shifts, product launches, and regional expansions. Too often, these two worlds exist in parallel, rarely intersecting in a way that provides actionable intelligence. The perennial question—"Did that exhibition actually move the needle, or was that PR push just noise?"—remains the industry’s most frustrating ambiguity.
Enter the Causality Report, a sophisticated analytical framework designed to bridge the gap between real-world business maneuvers and digital performance metrics. By moving beyond simple correlation, this tool provides a lens into the tangible ripple effects of business decisions, transforming raw data into a narrative of cause and effect.
The Core Concept: Moving Beyond Correlation
At its heart, a Causality Report is a visual and analytical tool that captures the "before-and-after" impact of a specific business event. Whether it is a flagship industry exhibition, a sudden pricing adjustment, or a targeted media relations campaign, the report allows users to annotate the exact date of the intervention and observe the subsequent trajectory of key performance indicators (KPIs).
The distinction between correlation and causality is the foundation of this approach. Correlation suggests that two things happen at the same time, but it offers no proof of a relationship. Causality, however, provides the evidence needed to justify resource allocation. When a company observes a statistically significant shift in search volume, lead velocity, or web traffic immediately following a localized marketing activation, the "noise" of daily operations begins to quiet, revealing the signal of successful strategy.
Chronology of an Impact: A Case Study in Data Alignment
To understand the efficacy of the Causality Report, one must examine the timeline of a strategic rollout. Imagine an organization planning a global product reveal for April 2025.
The Pre-Event Baseline
Before the event, the data team establishes a baseline. This involves identifying the "business as usual" performance metrics for the preceding quarter. By establishing this norm, the organization can quantify the "noise" that exists in the absence of a specific intervention.
The Annotation Phase
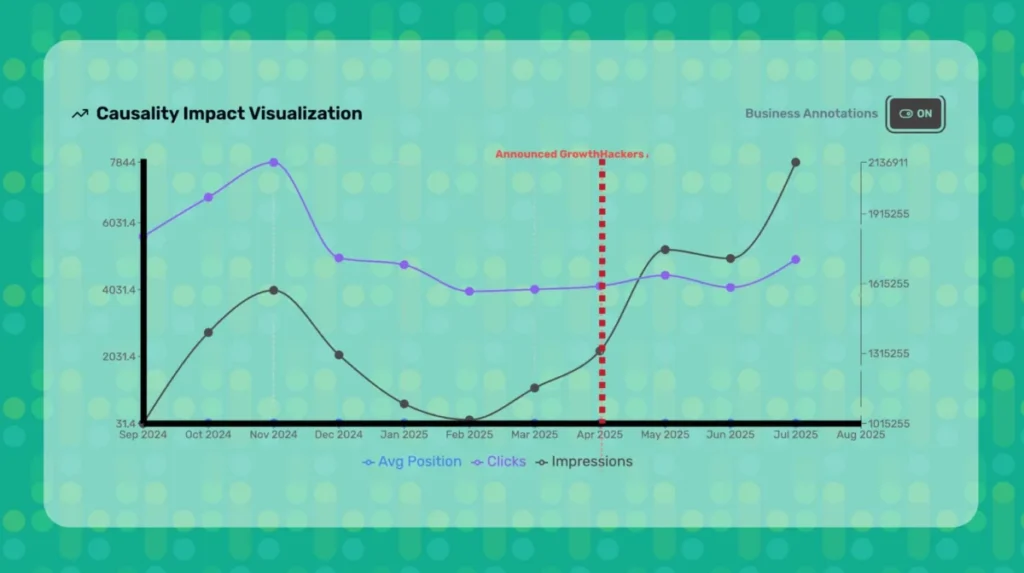
On the date of the event in April 2025, the team toggles the "Business Annotations ON" feature. This does not merely mark a point on a chart; it sets a marker for the entire data ecosystem to realign. Any shift in metrics—be it a surge in ad performance or a spike in direct traffic—is now contextualized against this specific milestone.
Post-Event Analysis
In the weeks following the April 2025 event, the Causality Report highlights a distinct divergence from the baseline. If impressions increased by 40% and click-through rates stabilized at a higher tier immediately following the announcement, the data provides a clear narrative: the business action directly catalyzed digital performance. This is not an assumption; it is a documented trajectory shift.
Supporting Data: Why Modern Analytics Demand Context
Most organizations currently operate with "passive data." They report on what happened, but rarely on why it happened. The Causality Report forces a shift toward "active intelligence."
The Synergy of Business Ops and Marketing
When companies integrate business operations data with marketing analytics, they unlock hidden efficiencies. For example, if a supply chain disruption occurs, marketing spend can be instantly throttled to prevent wasteful ad spend on out-of-stock items. Conversely, if a product is performing exceptionally well in a specific region, marketing can amplify messaging to capitalize on that momentum.
The supporting data for this methodology rests on the integration of disparate datasets:
- Customer Acquisition Cost (CAC) vs. Market Events: Mapping shifts in CAC against specific PR or trade show schedules.
- Search Volume Trends: Analyzing whether local events generate "branded search" interest, which serves as a leading indicator of future sales.
- Conversion Velocity: Tracking if the time-to-conversion shortens after a customer interacts with a specific high-value marketing asset.
Expert Perspectives: The Shift Toward Narrative Intelligence
Industry leaders are increasingly moving away from static dashboards. According to data strategists, the future of business intelligence lies in the ability to narrate the "story" behind the numbers.
"The problem with most reporting today is that it assumes the stakeholder knows the history of the company," says one lead data architect. "When you provide a report without annotations, you are asking the reader to play detective. The Causality Report removes that burden. It turns a chart into a story, allowing a CEO or a Board member to see exactly how a business move resulted in a digital payout."
By treating the "Business Annotations" toggle as a strategic layer rather than a UI feature, organizations empower their teams to communicate with greater clarity. It moves the conversation from "We spent X dollars" to "Our investment in Event Y resulted in a Z% improvement in organic traffic."
Implications for Future Strategy
The adoption of causality-based reporting carries significant implications for how companies structure their annual planning and resource distribution.
1. Eliminating Ineffective Spend
By identifying which activities consistently "move the needle," companies can ruthlessly eliminate initiatives that show no causal link to digital growth. This creates a leaner, more agile marketing budget.
2. Enhancing Team Accountability
When departments understand that their actions will be scrutinized against digital performance in a causality framework, they become more intentional. There is an increased focus on high-impact activities rather than "busy work" that fills a calendar but yields no measurable outcome.
3. Predictive Modeling
The ultimate goal of the Causality Report is to transition from reactive analysis to predictive modeling. Once a company has accumulated enough "annotated" data, they can begin to predict the expected outcome of future events. If a specific type of exhibition has historically produced a 15% increase in site traffic, the business can plan for that capacity accordingly.
When to Utilize the Causality Framework
The utility of this tool is not limited to singular events. It is most effective when applied across the spectrum of business operations:
- During Product Launches: Track the immediate digital appetite for a new SKU or service.
- During Competitive Shifts: Annotate when a competitor enters or leaves a market to see how your digital presence fluctuates in response.
- During Pricing Revisions: Observe how changes in product pricing affect conversion rates and search intent.
- During Macro-Economic Shifts: Note when seasonal or economic changes occur to determine if performance dips are industry-wide or company-specific.
Conclusion: Turning Metrics into Intelligence
The transition from mere data reporting to "narrative intelligence" is the defining challenge of the current business landscape. If you are not correlating your business actions with your digital metrics, you are effectively leaving intelligence on the table.
The Causality Report is not just another feature in a software suite; it is a fundamental shift in philosophy. It acknowledges that digital performance does not exist in a vacuum. It is the direct output of human, operational, and strategic decisions. By capturing these events, annotating them, and tracking their consequences, organizations can finally stop guessing and start knowing.
In an era where every dollar must be justified and every action must be optimized, the Causality Report provides the necessary rigor to move from passive reporting to active, evidence-based business growth. As we move further into 2025 and beyond, those who master the art of connecting their real-world actions to their digital footprints will be the ones who lead their respective markets. The question is no longer just "What happened?" but "Why did it happen, and how can we replicate that success?" Through the lens of causality, the answer finally becomes clear.
