
Last Modified on March 19, 2025
The New Frontier of Content Measurement: Beyond Vanity Metrics to Strategic Growth
In an increasingly saturated digital landscape, the notion that content performance can be adequately gauged by merely glancing at numbers in a report is rapidly becoming obsolete. As of March 19, 2025, the imperative for sophisticated, data-driven content measurement has never been more critical. Organizations and marketers are realizing that unlocking true content effectiveness demands a structured approach, a deep understanding of key performance indicators (KPIs), the identification of genuine growth drivers, and a robust grasp of technical implementation.
This comprehensive guide delves into the intricate world of content performance measurement, dissecting the methodologies, tools, and strategic frameworks necessary to transform raw data into actionable insights. From selecting the most pertinent metrics to constructing powerful, insightful reports, we aim to illuminate the path toward a truly data-centric content strategy.
![How to Measure Content Performance [+Reports] (2025)](https://measureschool.com/wp-content/uploads/2025/03/how-to-measure-content-performance.png)
The Imperative of Strategic Content Measurement
The digital realm is awash with content, from ephemeral social media posts to evergreen blog articles and immersive marketing campaigns. Amidst this deluge, the ability to discern what truly resonates, drives engagement, and contributes to business objectives is paramount. Many businesses fall into the trap of fixating on "vanity metrics" – numbers that look impressive but offer little strategic value. Page views, follower counts, or basic likes, while indicative of some activity, often fail to reveal the true impact of content on the bottom line.
True content performance measurement transcends these superficial indicators. It requires a meticulous process that begins with defining the content’s purpose and the audience it serves. This foundational step ensures that subsequent data collection and analysis are aligned with overarching business goals, allowing for a precise evaluation of return on investment (ROI) and fostering continuous optimization.
A Phased Approach to Unlocking Content Value
Measuring content performance effectively is not a singular task but a sequential, multi-faceted process. It involves a systematic journey from conceptualization to continuous refinement, ensuring that every piece of content serves a strategic purpose.
![How to Measure Content Performance [+Reports] (2025)](https://measureschool.com/wp-content/uploads/2025/03/Meta-ad-library-example-1-1024x489.webp)
Phase 1: Defining Your Content Universe and Objectives
The initial step in any robust measurement framework is to clearly define the content landscape under scrutiny and articulate its specific objectives. Different types of content, distributed across various platforms, demand distinct measurement strategies. A blog post’s success metrics will differ significantly from those of a video advertisement or an interactive landing page.
To simplify this often-complex environment, content can be broadly categorized, each demanding a tailored approach:
- Website Content: This encompasses blog articles, product pages, landing pages, "about us" sections, and any other textual or multimedia elements hosted on a primary domain. Its objectives typically revolve around attracting organic traffic, informing users, generating leads, and facilitating conversions.
- Social Media Content: Spanning platforms like Facebook, Instagram, X (formerly Twitter), LinkedIn, and TikTok, this category includes posts, stories, reels, live streams, and direct messages. Key objectives often include brand awareness, community building, engagement, driving traffic, and customer service.
- Marketing Campaign Content: This refers to content specifically created for paid advertisements, email marketing sequences, affiliate marketing, or other promotional efforts. Its primary goal is usually direct response: lead generation, sales, or specific user actions.
Unless operating with a singular, all-encompassing analytics tool, a "Measurement Plan" becomes indispensable. This foundational document serves as a centralized hub for listing relevant KPIs, establishing benchmarks, and clearly outlining content objectives for each category. A simple Google Sheet can be an effective starting point.
![How to Measure Content Performance [+Reports] (2025)](https://measureschool.com/wp-content/uploads/2025/03/SpyFu-example-1024x518.webp)
Phase 2: Crafting a Robust Measurement Framework – The Measurement Plan
A well-defined Measurement Plan is the cornerstone of effective content performance analysis. It ensures alignment between content creation efforts and business outcomes, preventing teams from getting lost in a sea of irrelevant data.
The core of this plan involves aligning on what constitutes "performance" for each content type and identifying the Key Performance Indicators (KPIs) that will accurately gauge this performance.
2.1. Website Metrics: Decoding User Interaction
![How to Measure Content Performance [+Reports] (2025)](https://measureschool.com/wp-content/uploads/2025/03/Wix-traffic-overview-1024x524.webp)
For website content, performance is often defined by how users interact with the site, their journey, and ultimately, their contribution to business goals. Standard metrics commonly include:
- Active Users (or Total Users): This metric indicates the number of unique individuals who have engaged with your website content within a specified period. It’s crucial for understanding audience reach and growth.
- Page Views: A count of how many times pages on your site were viewed. While a high number can be positive, it needs context from other metrics to indicate actual engagement.
- Sessions: Represents a group of user interactions with your website that take place within a given time frame (e.g., 30-minute intervals). It helps understand the frequency and depth of engagement.
- Average Engagement Time: The average duration users spend actively interacting with your content. A longer engagement time often signifies more valuable or compelling content.
- Events: Specific, trackable actions users take on your site, such as clicking a button, downloading a file, watching a video, or submitting a form. Events provide granular insight into user behavior.
- Key Events (or Goals): These are the most important actions you want users to take, directly tied to your business objectives. Examples include completing a purchase, signing up for a newsletter, or requesting a demo.
- Revenue: For e-commerce sites, this is the ultimate bottom-line metric, directly measuring the financial return generated by content.
Technical Foundation: Implementing Analytics Tools
To capture these vital website metrics, installing an analytics tool is non-negotiable. The process typically involves three common methods: direct code implementation, using a Content Management System (CMS) plugin, or deploying via a Tag Management System (TMS) like Google Tag Manager (GTM). Given the industry’s shift, familiarity with tools like Google Analytics 4 (GA4) is essential, as detailed in guides on its installation via GTM.
2.2. Social Media & Marketing Campaign Metrics: Gauging Reach, Engagement, and Conversion
![How to Measure Content Performance [+Reports] (2025)](https://measureschool.com/wp-content/uploads/2025/03/GA4-landing-page-report-1024x492.webp)
For content distributed across social media platforms and through dedicated marketing campaigns, a different set of KPIs comes into play, reflecting the unique dynamics of these channels:
- Reach: The total number of unique users who saw your content. This metric is crucial for understanding audience breadth.
- Impressions: The total number of times your content was displayed, regardless of whether it was clicked. Impressions can be higher than reach if users see your content multiple times.
- Engagement Rate: A measure of how actively users interact with your content (likes, comments, shares, clicks) relative to its reach or impressions. High engagement signifies resonance.
- Clicks: The number of times users clicked on your content, often leading to a website or landing page.
- Conversions: Specific desired actions taken by users after interacting with your campaign content, such as a purchase, sign-up, or download.
- Cost Per Acquisition (CPA): The cost incurred to acquire a single customer or lead through a marketing campaign. Essential for evaluating campaign efficiency.
- Return on Investment (ROI): The financial return generated from a campaign relative to its cost. The ultimate measure of campaign profitability.
- Lead Generation: The number of potential customers identified or acquired through campaign efforts.
- Brand Mentions: The frequency with which your brand is mentioned across social media or other online platforms. Important for brand visibility and sentiment.
- Follower Growth: The increase in your audience size on social media platforms, indicating expanding reach.
- Sentiment: The overall emotional tone (positive, negative, neutral) associated with mentions of your brand or content.
- Shares: When users disseminate your content to their own networks, indicating strong advocacy.
- Comments: Direct user feedback and interaction with your content.
- Likes/Reactions: Basic indicators of approval or emotional response.
The Measurement Plan is not merely a list; it is a strategic document that helps teams remain focused on the metrics that truly matter, cutting through the noise of numerous data points available in modern analytics platforms.
Phase 3: Benchmarking for Competitive Edge and Growth
Once KPIs are established and data collection is underway, the next critical step is benchmarking. This involves comparing your performance against internal historical data and external industry standards or competitors.
![How to Measure Content Performance [+Reports] (2025)](https://measureschool.com/wp-content/uploads/2025/03/GA4-Pages-and-screens-report-1024x490.webp)
3.1. Internal Benchmarking: Establishing Baselines and Setting Realistic Goals
Before looking outward, it’s vital to look inward. By tracking monthly and weekly averages for your chosen KPIs, you establish a baseline for your content’s performance. For instance, if a blog post consistently attracts 500 unique users per week, this becomes your internal benchmark. From this baseline, you can set realistic, incremental goals. A target of 3,000 users might translate into a planned 30% increase, aiming for 650 users per week, making the goal achievable and measurable. This iterative process applies universally across all content types and metrics.
3.2. External Benchmarking: Gaining a Competitive Advantage
![How to Measure Content Performance [+Reports] (2025)](https://measureschool.com/wp-content/uploads/2025/03/Search-console-report-1024x656.webp)
After assessing internal trends, the focus shifts to external benchmarking. This involves comparing your performance against:
- Direct Competitors: Companies offering similar products or services.
- Industry Averages: General performance benchmarks for your sector.
- Best-in-Class Performers: Leaders in content strategy, even if not direct competitors.
Several competitive intelligence tools can provide invaluable insights not only into competitor performance but also into the strategies underpinning their success. Tools like the Meta Ad Library offer transparency into competitors’ active ad campaigns, creative assets, and targeting strategies. SpyFu and Semrush provide comprehensive insights into organic and paid search performance, keyword rankings, backlink profiles, and competitor content strategies. Ahrefs excels in backlink analysis, keyword research, and content gap identification. Leveraging these tools transforms competitive analysis from guesswork into a strategic advantage.
Phase 4: Scaling Analytics and Reporting for Actionable Insights
As content operations expand and encompass multiple platforms, tracking performance individually becomes impractical and inefficient. Scaling analytics involves integrating data from disparate sources into a cohesive reporting framework, providing a holistic view of content impact.
![How to Measure Content Performance [+Reports] (2025)](https://measureschool.com/wp-content/uploads/2025/03/Explorations-in-GA4-1024x551.webp)
4.1. The Content Performance Report: Automating Insights
Automating the creation of content performance reports is crucial for efficiency and consistency. This eliminates repetitive manual data extraction and allows teams to address key questions swiftly. Various report types are available, from built-in platform reports to highly customized dashboards.
4.1.1. Pre-made Reports: Leveraging Built-in Analytics
Many platforms offer robust, built-in analytics that serve as an excellent starting point:
![How to Measure Content Performance [+Reports] (2025)](https://measureschool.com/wp-content/uploads/2025/03/Looker-studio-gallery-1024x491.webp)
- CMS Analytics: Platforms like Wix provide integrated analytics dashboards, offering immediate insights into website traffic, user behavior, and content performance directly within the content management system.
- Google Analytics 4 (GA4): For deeper, more comprehensive insights into website traffic and user behavior, GA4 is the industry standard. It offers powerful default reports that can reveal how audiences interact with content, identify top-performing assets, and highlight areas for improvement.
- Landing Page Report: This report provides critical insights into users’ first impressions. It reveals which pages serve as entry points to your website, making them deserving of careful design and optimization. The report helps answer questions like: "Which pages attract the most new visitors?" and "Are users finding what they expect upon arrival?" Further analysis using GA4’s Path Exploration feature can reveal user journeys, identifying potential bottlenecks or "looping behavior" where users repeatedly navigate between pages, suggesting confusion or a lack of clear information.
- Pages and Screens Report: Unlike the Landing Page report, this report provides a holistic view of all pages and screens (including mobile app screens) on your website, regardless of whether they were entry points. It answers the fundamental question: "What are our most popular content pieces or pages?"
- Performance Report (Search Results) in Google Search Console: While overlapping with GA4, this report specifically focuses on how your website content performs in search engine results. It highlights not just which pages are ranking, but crucially, which specific search queries trigger your content to appear, and which queries drive the most traffic. It also provides device-specific performance, invaluable for mobile-first strategies.
4.1.2. Custom Reports: Tailoring Data to Business Needs
Beyond pre-made reports, the power of customization in analytics tools like GA4 allows for deeper, more relevant insights. Users can:
- Apply Filters: Focus on specific audience segments, traffic sources, or content types.
- Add Secondary Dimensions: Break down tables further (e.g., analyzing landing page performance by traffic source or user device).
- Modify/Remove Metrics: Streamline reports to display only the most pertinent KPIs.
For advanced analysis, GA4’s Explorations feature offers unparalleled flexibility. It enables users to mix and match dimensions and metrics to build entirely new reports, conduct funnel analysis, path analysis, segment overlap, and user exploration, going far beyond standard reporting capabilities to uncover nuanced insights.
4.1.3. Report Templates: Accelerating Insight Generation
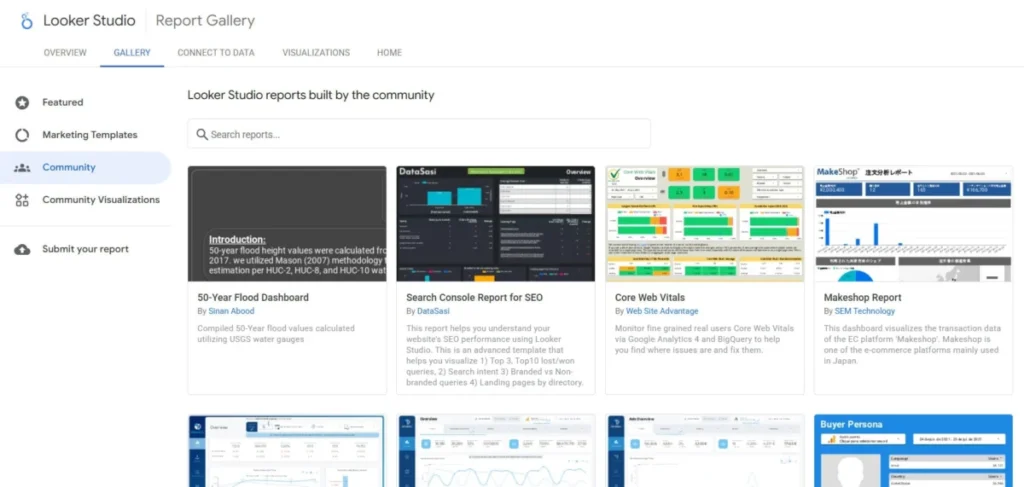
To significantly speed up content measurement, leveraging report templates is highly recommended. Platforms like Looker Studio (formerly Google Data Studio) offer extensive galleries of ready-to-use templates. These templates, designed by experts, come pre-configured with charts, tables, and filters, requiring only a connection to your data sources. The Looker Studio Community further expands this resource, providing diverse templates that can be used directly or as inspiration for custom dashboards.
![How to Measure Content Performance [+Reports] (2025)](https://measureschool.com/wp-content/uploads/2025/03/Looker-studio-community-1024x488.webp)
4.1.4. Multi-Channel Reports: The Holistic View
The challenge of measuring content performance across a fragmented digital ecosystem is significant. Multi-channel reporting addresses this by consolidating data from diverse sources – social media, web analytics, CRM systems, email platforms – into a single, cohesive view. This holistic perspective is vital for understanding the true, cumulative impact of content.
For smaller-scale operations, manually exporting data to Google Sheets or Excel and then integrating it into a visualization tool can suffice. However, as content operations scale, automation becomes essential. Tools like Supermetrics and Coupler.io specialize in automating data collection from various platforms, feeding it into central repositories. This consolidated data can then be connected via specialized "connectors" to powerful visualization tools such as Looker Studio, Tableau, or Power BI. This setup ensures real-time, interactive reporting without the burden of constant manual updates, enabling rapid, data-driven decision-making. Examples like Coupler.io’s "Multi-channel creatives performance dashboard" or the "All-in-one marketing dashboard" demonstrate the power of such integrated reporting.
Implications: The Transformative Impact of Data-Driven Content
The commitment to rigorous content performance measurement carries profound implications for any organization operating in the digital sphere:
![How to Measure Content Performance [+Reports] (2025)](https://measureschool.com/wp-content/uploads/2025/03/Coupler.io-dashboard-creatives-1024x477.webp)
- Strategic Optimization: Data-driven insights empower content creators and marketers to move beyond guesswork. Understanding which content resonates, on which platforms, and with which audiences, allows for continuous optimization of content strategy, creative direction, distribution channels, and promotional tactics. This leads to higher engagement, better conversions, and ultimately, more effective use of resources.
- Resource Allocation: By identifying high-performing content and channels, organizations can make smarter decisions about where to invest their time, budget, and creative energy. Conversely, underperforming content can be identified and either revamped, repurposed, or retired, preventing wasted effort.
- Competitive Advantage: A deep understanding of your own content performance, coupled with competitive benchmarking, provides a significant edge. It allows you to identify market gaps, anticipate audience needs, and learn from competitor successes and failures, positioning your brand as a leader.
- Business Growth: The ultimate implication of effective content measurement is its direct correlation with achieving broader business objectives. Whether the goal is increased brand awareness, lead generation, customer acquisition, customer retention, or direct revenue growth, a data-driven content strategy is a powerful engine for achieving these outcomes.
- Future-Proofing: The digital landscape is in constant flux. By establishing robust measurement frameworks, organizations build the capacity to adapt quickly to changing algorithms, emerging platforms, and evolving consumer behaviors. This agility is critical for sustained relevance and success.
Summary
Measuring content performance is far from a simplistic exercise in checking numbers. It is a strategic imperative that, when executed with precision and insight, becomes a potent catalyst for growth. This guide has traversed the essential stages, from meticulously defining content categories and selecting impactful KPIs to leveraging pre-made, custom, and multi-channel reports for profound insights.
For those eager to further sharpen their measurement acumen, exploring advanced topics such as the "Top 5 Blog Metrics to Track for Growth and Success" can provide an ideal next step, solidifying a truly data-driven and results-focused content strategy.
The journey to mastering content performance is continuous. What methods have you found most effective in measuring content performance? Are there particular KPIs, processes, or tools that have proven indispensable in your experience? Share your insights and experiences in the comments below – your contributions are invaluable to the collective understanding of this evolving field.
