

Last Modified on March 19, 2025
The Digital Shop Window: Why Landing Page Metrics Are Crucial for Business Success
In the bustling marketplace of the internet, a website functions as a digital storefront. Within this store, landing pages are the meticulously designed display windows, strategically positioned to capture immediate attention and guide potential customers towards a desired action. Much like a compelling shop window entices passersby to step inside, a well-optimized landing page determines whether a visitor engages with a brand or "bounces" away, potentially never to return.
The stakes are remarkably high. These initial interactions are often the culmination of significant financial investment in digital marketing, including sophisticated ad campaigns and rigorous search engine optimization (SEO) efforts. Digital marketers pour considerable resources into directing targeted traffic to specific landing pages, each designed with a precise conversion goal in mind. Consequently, understanding visitor behavior on these pages and accurately measuring their performance is not merely advantageous; it is an absolute imperative for maximizing return on investment (ROI) and achieving business objectives.
This article delves into the critical importance of landing page analytics, outlining the top 10 metrics that every digital marketer and business owner must track. Regardless of the analytics platform employed, these insights form the bedrock of data-driven decision-making, enabling continuous optimization and sustained growth.
The Foundation of Digital Engagement: Why Landing Pages Matter
A landing page’s significance stems from its singular focus: to convert visitors into leads, customers, or engaged users. Unlike broader website pages, landing pages are purpose-built for specific campaigns, offering tailored content that aligns directly with the user’s initial query or ad click. This direct correlation makes them pivotal touchpoints in the customer journey.
The first impression a landing page delivers can be the difference between a successful conversion and a lost opportunity. Visitors form rapid judgments about a page’s relevance, trustworthiness, and ease of use. If a page fails to meet their expectations quickly, they are likely to leave, negating the marketing effort and cost expended to bring them there. Therefore, meticulous tracking and analysis of landing page performance are non-negotiable for any entity serious about its online presence and profitability.
Navigating the Metrics Landscape: A Chronological Approach to Analysis
While "chronology" in a news sense typically refers to a timeline of events, in the context of analytics, it can be interpreted as a logical progression through the user’s journey and the corresponding data points that reveal insights at each stage. We will explore metrics from traffic acquisition, through on-page engagement, to ultimate conversion and its associated costs.
Essential Landing Page Metrics: Supporting Data and Interpretations
Here, we break down the top 10 landing page metrics, providing formulas, interpretation, and actionable insights.

1. Traffic Sources: Understanding Your Audience’s Origin
While not a metric in itself, analyzing metrics by traffic source is fundamental. Before diving into specific performance indicators, it is crucial to understand where your visitors are coming from. This dimension provides invaluable context for all subsequent metrics.
Supporting Data: Traffic sources can include Organic Search, Paid Search, Paid Social, Referral, Direct, and Email. Each source brings users with potentially different intent and expectations. For example, users from a "Paid Search" ad for a specific product might have higher purchase intent than those arriving via a general "Organic Search" for informational content.
Implications: By segmenting metrics like conversion rate or bounce rate by traffic source, marketers can identify which channels are most effective and which require optimization. If Paid Search, despite a high budget, shows lower conversion rates compared to Paid Social for a specific landing page, it signals a need to re-evaluate keywords, ad copy, or even the landing page’s alignment with Paid Search intent. Conversely, strong performance from a particular source may warrant increased investment.
2. Conversion Rate (CR): The Ultimate Goal Attainment Metric
The cornerstone of landing page performance, Conversion Rate measures the percentage of visitors who complete a desired action. This could range from submitting a lead form, downloading an e-book, signing up for a newsletter, to making a direct purchase.
Formula: (Total Conversions / Total Visitors) * 100
Supporting Data: A conversion can be a "micro-conversion" (e.g., clicking a video) or a "macro-conversion" (e.g., a purchase). Tracking both provides a holistic view of user progression. Industry benchmarks for conversion rates vary wildly (e.g., e-commerce typically lower than lead generation), often ranging from 2% to 10% or higher depending on the industry, offer, and traffic source. For instance, Hubspot suggests an average range of 2.35% to 5.31%, with top performers reaching 11%+.
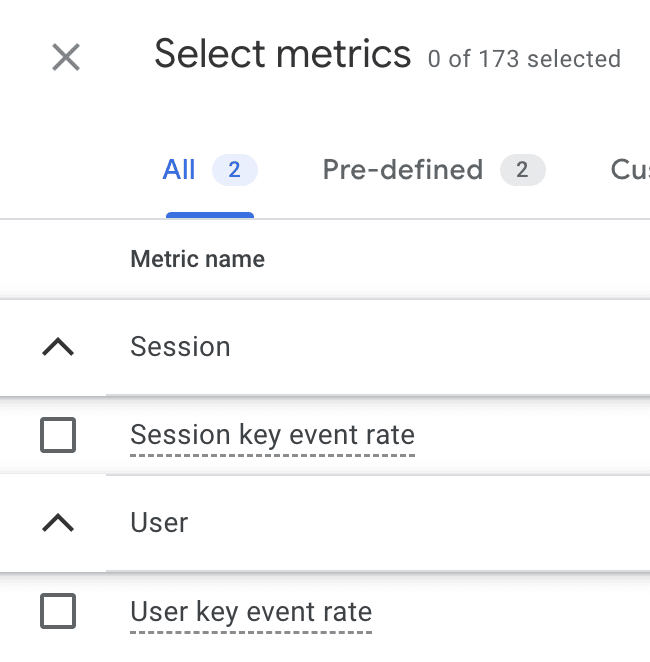
Official Responses/Expert Opinion: Google Analytics 4 (GA4) provides "Key Event Rates" (session and user conversion rates), allowing for granular tracking. Experts emphasize that a "good" conversion rate is relative; continuous improvement through A/B testing and optimization is paramount.
Implications: A high conversion rate indicates effective alignment between traffic source, landing page content, and offer. Low rates demand immediate attention, prompting investigations into messaging, user experience, call-to-action (CTA) clarity, or technical issues. Optimizing CR directly impacts ROI, as more value is extracted from existing traffic.
3. Bounce Rate: Gauging Immediate Engagement (or Lack Thereof)
Bounce Rate quantifies the percentage of single-page sessions where a user enters a page and exits without any further interaction. It’s a critical indicator of initial engagement and relevance.
Formula: (Sessions with one page / Total Sessions) * 100
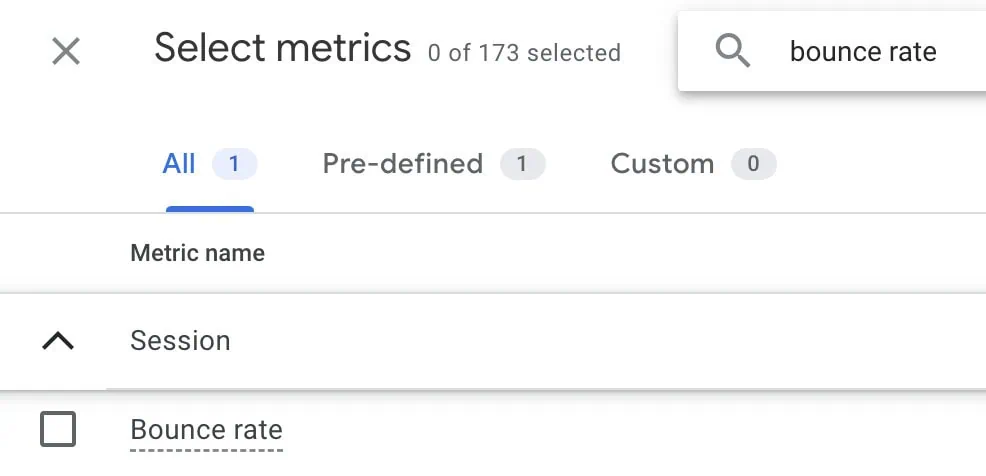
Supporting Data: In GA4, a bounce is recorded when a session contains only one engagement event. High bounce rates (e.g., 70%+) often suggest that the page did not meet user expectations, was slow to load, or had confusing navigation. However, for certain pages (e.g., a blog post providing a quick answer), a high bounce rate might be acceptable if the user found what they needed instantly. Hubspot estimates typical bounce rates between 26% and 70%.
Official Responses/Expert Opinion: While traditionally a high bounce rate was seen as universally bad, modern analytics acknowledges context. A low bounce rate (under 20%) can sometimes indicate tracking errors.
Implications: A consistently high bounce rate on a conversion-focused landing page is a red flag. It necessitates reviewing elements like ad copy-to-page alignment, page load speed, mobile responsiveness, visual hierarchy, and headline effectiveness. Reducing bounce rate improves engagement and provides more opportunities for conversion.
4. Average Time on Page (Average Engagement Time): Depth of Interaction
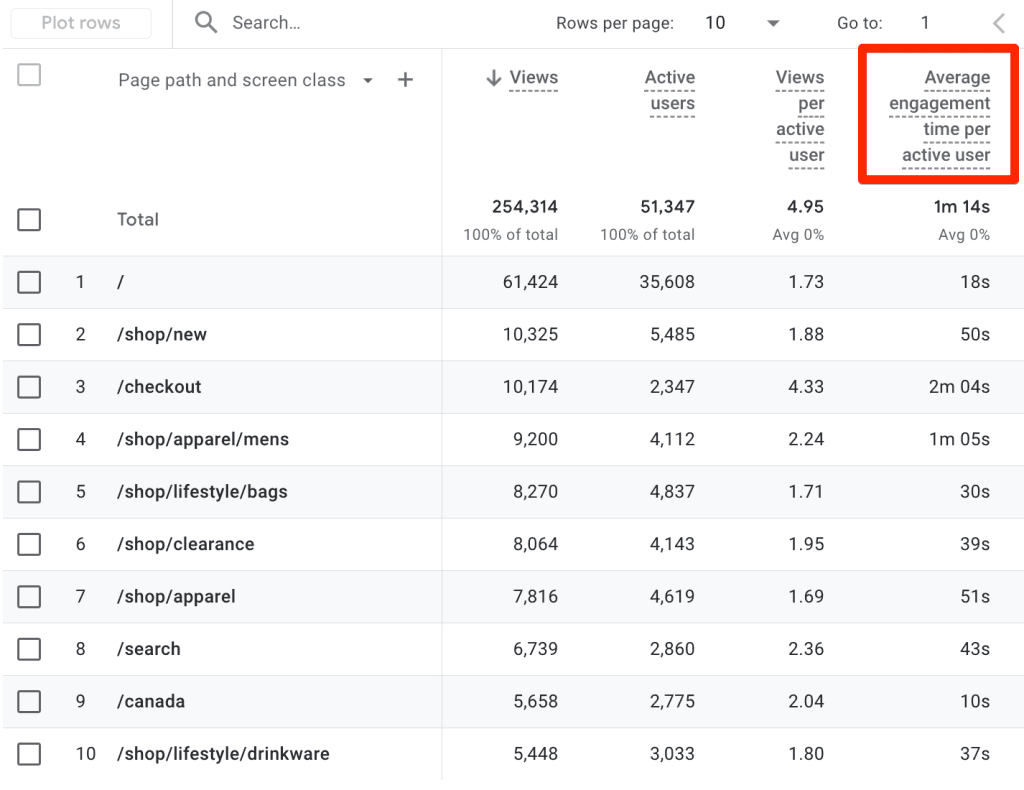
This metric measures how long visitors actively spend on a specific landing page. GA4 refines this with "Average Engagement Time," which only counts time when the page is in focus and the user is actively interacting.
Supporting Data: For complex products, educational content, or high-value offers, a longer average engagement time is often desirable, indicating users are carefully considering the information. Conversely, for simple lead-gen forms, a very high time on page might suggest confusion or difficulty in completing the form.
Implications: Analyze this metric in conjunction with page content. If a long-form sales page has a low engagement time, it suggests content is not captivating or is poorly structured. If a simple form page has an unusually high engagement time, it could point to technical glitches or overly complex fields. Optimizing content readability, adding interactive elements, and ensuring clear calls to action can improve engagement.
5. Form Abandonment Rate: Uncovering Friction in Lead Capture
Relevant for any landing page featuring a form, this metric identifies the percentage of users who start a form but do not complete it. It highlights points of friction in the lead capture process.
Formula: (Forms Started - Forms Completed) / Forms Started * 100
Supporting Data: For example, if 600 users begin a form and 240 complete it, the abandonment rate is (600 - 240) / 600 * 100 = 60%. Common reasons for abandonment include excessive fields, privacy concerns, unclear instructions, technical errors, or a lack of perceived value for submitting information.
Official Responses/Expert Opinion: While GA4 requires custom event tracking for form interactions, dedicated form analytics tools often provide this out-of-the-box. Experts recommend minimizing fields, using progress bars for multi-step forms, and providing clear error messages.
Implications: A high form abandonment rate directly impacts lead generation efforts. Optimizing forms by reducing complexity, clarifying value propositions, and ensuring mobile-friendliness can significantly boost lead capture. This metric is crucial for improving the efficiency of sales funnels.
6. Cost Per Conversion (CPC): Measuring Marketing Efficiency
For campaigns driven by paid advertising, Cost Per Conversion (also known as Cost Per Acquisition, CPA) is vital. It calculates the financial outlay required to achieve a single conversion.
Formula: Marketing Cost ($) / Total Conversions
Supporting Data: If a campaign spends $2,500 and yields 121 conversions, the CPC is $2,500 / 121 = $20.67. This metric must be weighed against the Lifetime Value (LTV) of a customer or the direct revenue generated by the conversion. Ideally, CPC should be significantly lower than the value obtained from that conversion to ensure profitability.
Implications: A high CPC indicates inefficient spending, suggesting issues with ad targeting, ad copy, or landing page effectiveness. Conversely, a low CPC signifies a highly efficient campaign. Monitoring CPC allows marketers to optimize bids, refine targeting, and improve landing page conversion rates to maximize budget utilization and improve overall campaign ROI.
7. Exit Rate: Identifying Drop-off Points in the User Journey
While often confused with bounce rate, Exit Rate is distinct. It measures the percentage of sessions that end on a specific page, regardless of how many pages the user visited prior.
Formula: (Number of Exits on Page / Total Pageviews for Page) * 100
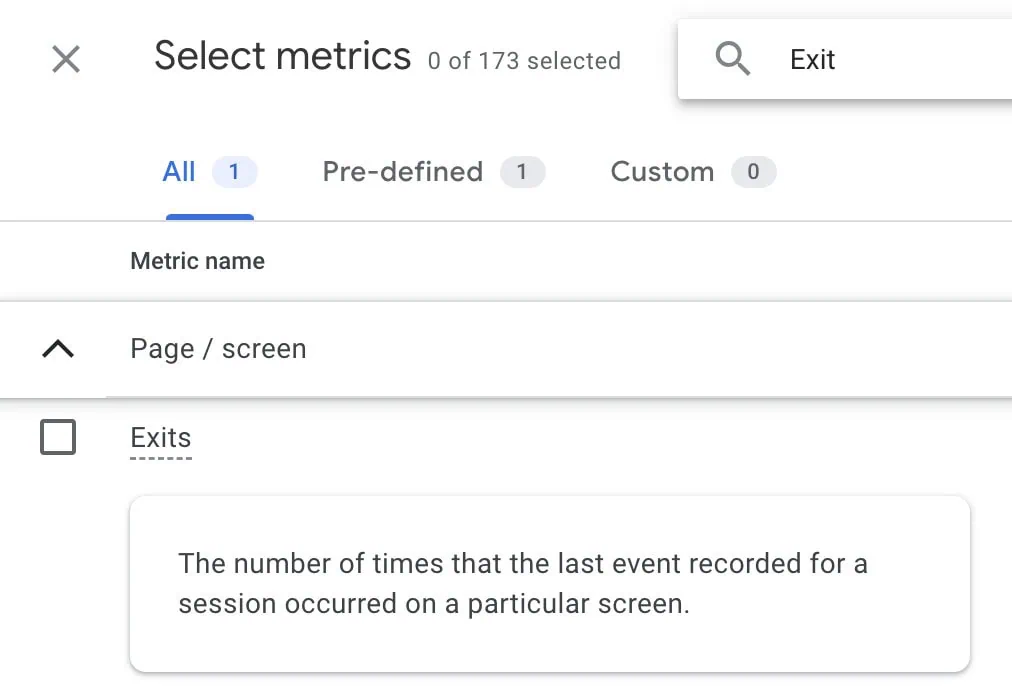
Supporting Data: A page that registers a bounce will also count as an exit. However, a user visiting multiple pages before leaving on a particular page contributes to that page’s exit rate, but not its bounce rate. GA4 provides "exits" as a metric, requiring custom calculation for the rate.
Implications: A high exit rate on a critical page within a multi-page conversion funnel (e.g., a checkout page or a product detail page meant to precede a purchase) is problematic. It suggests users are abandoning the desired path at that specific point. Analyzing exit rates helps identify bottlenecks in the user journey, prompting investigation into content relevance, navigation, or technical issues on those pages.
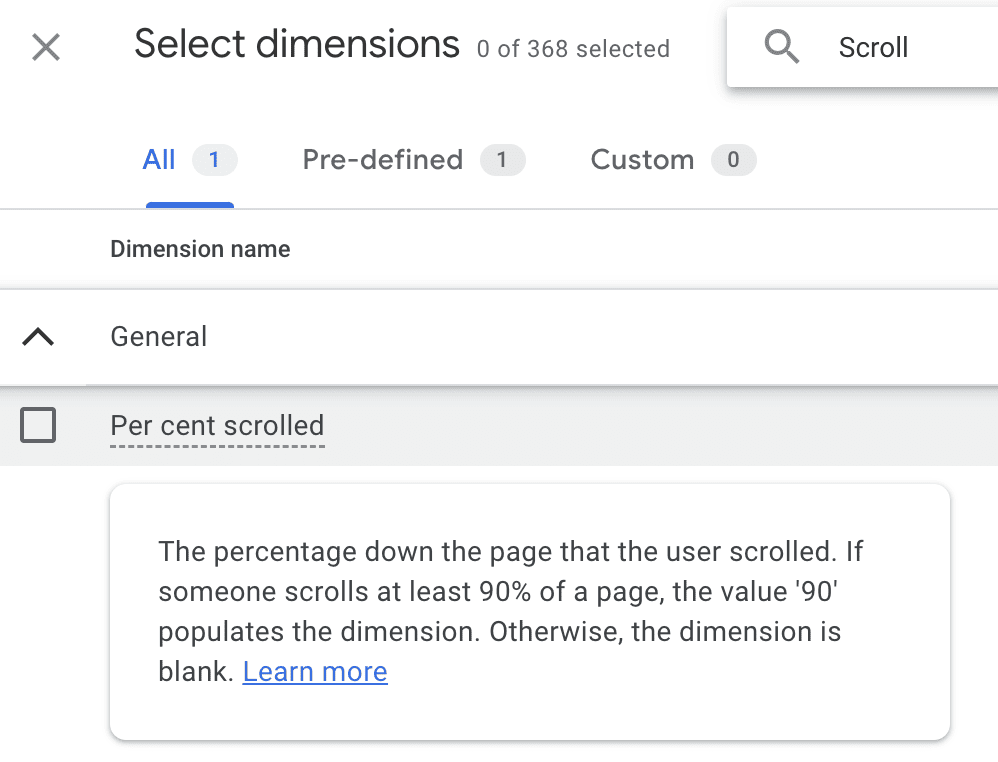
8. Scroll Depth: Understanding Content Consumption
Scroll Depth measures how far down a page visitors scroll, typically expressed as a percentage (e.g., 25%, 50%, 75%, 100%). It’s a key engagement metric for pages with significant content.
Supporting Data: This metric is crucial for long-form landing pages, product pages with extensive details, or pages featuring multiple CTAs or trust signals (e.g., testimonials, security badges) placed "below the fold."
Official Responses/Expert Opinion: GA4 tracks scroll depth as an enhanced measurement event, available as a dimension. Visual analytics tools like heatmaps (Hotjar, Clarity) complement this data by visually representing scroll patterns.
Implications: If critical information or primary CTAs are consistently missed due to low scroll depth, content reordering or design adjustments are necessary. Conversely, high scroll depth indicates users are engaged with the full breadth of content. This metric directly informs content strategy and page layout optimization.
9. Click-Through Rate (CTR) for On-Page Elements: Guiding User Action
Beyond ad CTR, this metric applies to internal elements on a landing page, such as buttons, links, or interactive components that guide users to another page or reveal more information.
Formula: (Total Clicks on Element / Total Impressions of Element) * 100
Supporting Data: If a primary CTA button is visible 2,340 times and clicked 107 times, its CTR is (107 / 2340) * 100 = 4.57%. A high CTR suggests compelling copy, effective design, and clear value proposition for clicking.
Implications: A low on-page CTR indicates that users are not motivated to take the next step. This could be due to weak CTA copy, poor button placement, insufficient visual prominence, or a lack of trust. Optimizing these elements through A/B testing can significantly improve user flow and conversion rates, ensuring visitors are guided efficiently through the desired journey.
10. New vs. Returning Visitors: Tailoring the User Experience
Segmenting visitor data into "New" and "Returning" provides valuable insights into audience behavior and allows for tailored strategies.
Supporting Data: New visitors are often in the discovery phase, seeking information and evaluating trust, while returning visitors may be closer to conversion, looking for specific details, or comparing options. GA4 readily provides this distinction.
Implications: Analyzing other metrics (e.g., bounce rate, conversion rate) by visitor type can reveal divergent behaviors. If new visitors have a significantly higher bounce rate, the landing page might not be effectively onboarding them or setting clear expectations. Returning visitors, if they show higher engagement or conversion rates, might benefit from personalized content or retargeting efforts. This segmentation allows for more nuanced personalization and optimization, improving the experience for both first-timers and loyal users.
The Broader Implications: From Data to Strategic Action
Tracking these metrics is not an end in itself; it is the means to informed decision-making and continuous improvement. The data gathered provides a quantitative "what" about user behavior. To understand the "why," these quantitative insights must be paired with qualitative analysis.
Official Responses/Expert Opinion: Digital analytics experts strongly advocate for combining quantitative data from tools like GA4 with qualitative feedback. This includes:
- Behavioral Web Analytics Tools: Platforms like Hotjar or Microsoft Clarity offer heatmaps (showing where users click, move, and scroll) and session recordings (replaying user journeys). These tools provide visual context, revealing areas of confusion, overlooked content, or unexpected interactions.
- User Testing: Observing real users interacting with the landing page can uncover usability issues that metrics alone might not pinpoint.
- Custom Interviews & Surveys: Direct feedback from users, including exit-intent surveys, can articulate their hesitations, needs, and perceptions.
Implications: A holistic approach to landing page optimization involves an iterative cycle of measuring, analyzing, testing, and refining. By understanding which metrics are most critical to their specific business goals and investing in both quantitative and qualitative analysis, organizations can:
- Optimize Marketing Spend: Direct budgets to channels and campaigns that yield the highest ROI.
- Enhance User Experience (UX): Create more intuitive, engaging, and trustworthy landing pages.
- Improve Conversion Rates: Turn more visitors into valuable leads or customers.
- Boost Business Growth: Drive sustainable success through data-driven strategies.
Conclusion: The Continuous Pursuit of Landing Page Excellence
Landing pages are dynamic assets that require ongoing attention. The digital landscape is ever-evolving, and user expectations are constantly shifting. Therefore, the commitment to tracking, analyzing, and optimizing these 10 key metrics – and others specific to niche business needs – must be unwavering.
The most profound insights often emerge not from looking at a single metric in isolation, but from understanding their interdependencies and segmenting them by dimensions like traffic source or visitor type. By embracing this comprehensive analytical framework, businesses can transform their landing pages from mere digital brochures into powerful conversion engines, consistently delivering value and propelling growth in an increasingly competitive online world. The journey of optimization is continuous, and armed with these insights, marketers are well-equipped to navigate it successfully.
