
Unlocking Performance: Crazy Egg Debuts Advanced Engagement Metrics for Surveys and CTAs
By Editorial Staff | October 9, 2026
In the fast-paced world of digital marketing, the difference between a high-converting website and one that suffers from high bounce rates often comes down to the subtle art of user engagement. For years, marketers have relied on on-page widgets—specifically popup surveys and Calls-to-Action (CTAs)—to guide user behavior without forcing them away from their current page journey.
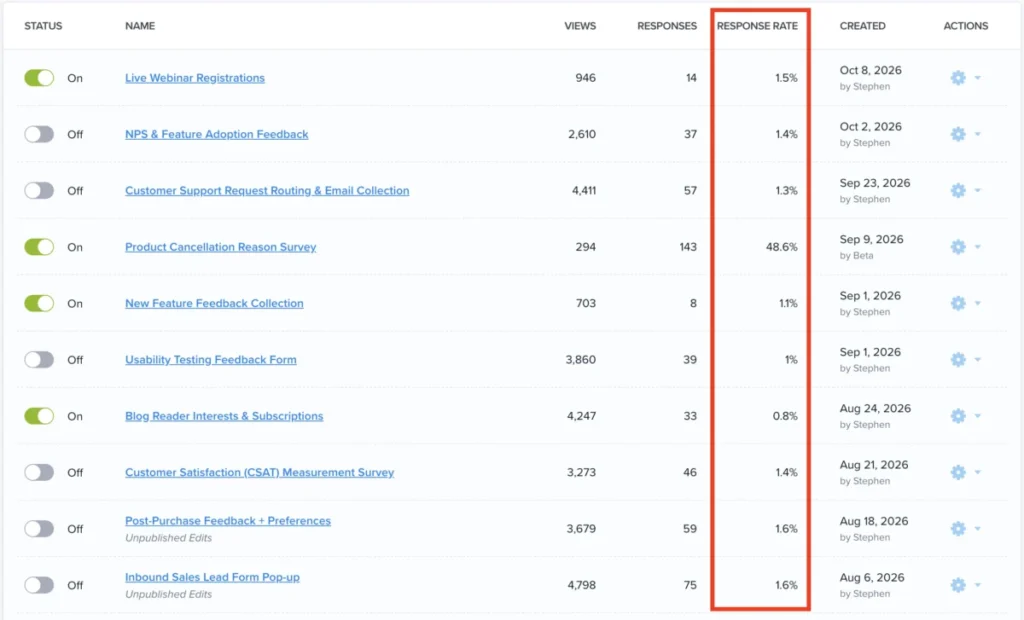
However, measuring the efficacy of these tools has often been a fragmented experience. Today, Crazy Egg, a leader in website optimization and user behavior analytics, announced a significant update to its platform: the integration of comprehensive engagement rate metrics directly into their Surveys and CTA dashboards. This shift moves the industry away from raw volume reporting toward a more nuanced, percentage-based analysis of user interaction.
The Core Update: Moving Beyond Raw Volume
For many digital marketers, the dashboard is a battleground of data points. Historically, Crazy Egg users could track the "volume" metrics of their widgets—how many times a survey was shown, how many clicks a CTA received, and the total number of conversions generated. While these figures are essential for understanding total output, they often mask the underlying efficiency of the widget itself.
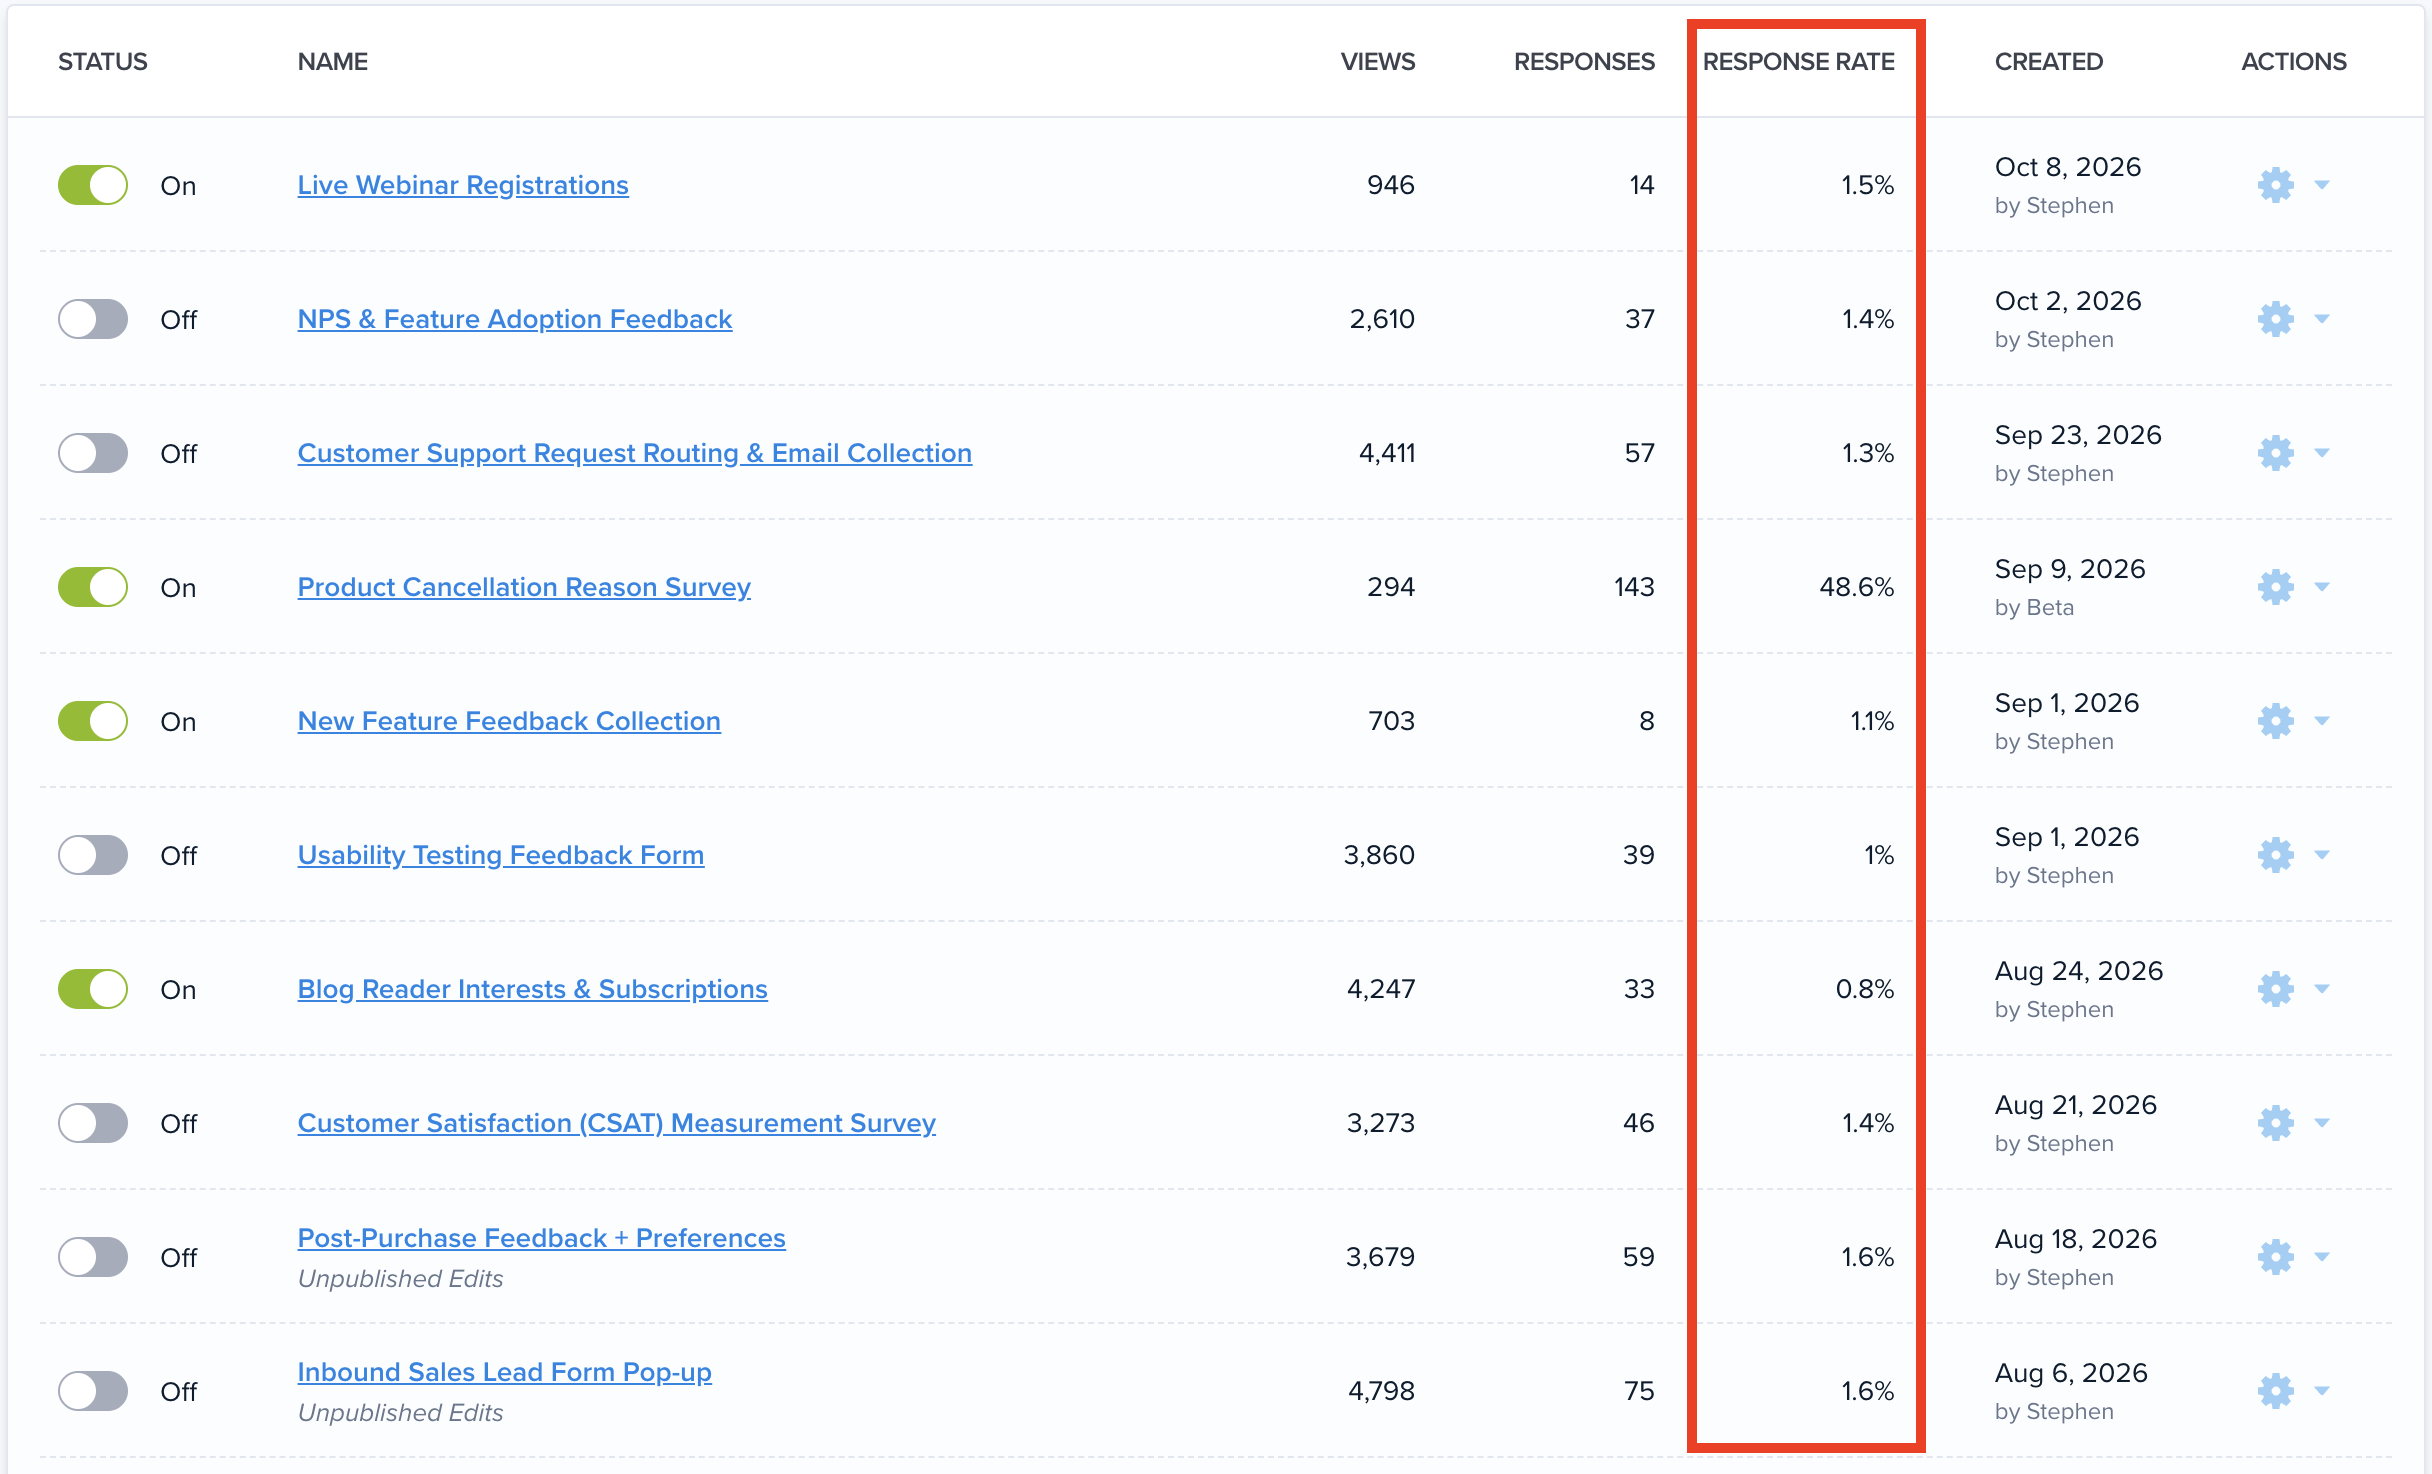
With the new update, Crazy Egg has introduced a layer of engagement rate metrics that allow users to compare the success of their overlays side-by-side. By shifting the focus to percentages—the ratio of views to responses or clicks—marketers can now instantly identify which headlines, offers, and visual flows are actually resonating with their audience.
"If you only look at volume, you might mistake a high-traffic page for a high-converting one," says Stephen Ngo, Director of Growth Marketing at Crazy Egg. "By viewing engagement rates, our users can now normalize the performance of their widgets across different segments, allowing for a true ‘apples-to-apples’ comparison of what is working and what needs adjustment."
A Chronology of Optimization: The Evolution of On-Page Analytics
The journey toward this feature release reflects a broader trend in the MarTech industry toward actionable, data-driven design.
- Early 2024: The industry-wide push for "non-disruptive" marketing saw a massive uptick in the use of overlays and sticky CTAs. Companies moved away from full-page interstitials, which often penalized SEO rankings.
- Late 2024 – 2025: As the popularity of these tools grew, so did the frustration regarding "data blindness." Marketers reported that while they could see conversion counts, they struggled to optimize the content within the widgets because they couldn’t see the conversion rate per widget variation.
- Early 2026: Crazy Egg began an internal beta program to synthesize raw event logs into percentage-based engagement ratios. This aimed to solve the "correlation vs. causation" problem that plagued many A/B testing efforts.
- October 2026: Official rollout of the integrated dashboard metrics. This update provides a unified view where marketers can track the lifecycle of a user’s interaction, from the initial impression to the final conversion, all measured against the total pool of visitors.
Supporting Data: Why Engagement Rates Matter
In website optimization, the "Volume Trap" is a well-documented phenomenon. A popup survey shown to 10,000 people with 100 responses has a 1% engagement rate. Conversely, a survey shown to 1,000 people with 50 responses has a 5% engagement rate.
Under the old reporting models, the first survey appeared to be the "winner" because it generated more total responses. However, a data-driven marketer understands that the second survey is significantly more effective at capturing attention. By implementing these new metrics, Crazy Egg is providing the tools necessary to uncover these hidden efficiency gaps.
Key Metrics Now Available:
- View-to-Response Ratio: Measures the percentage of users who see a popup survey and proceed to engage with the questions.
- View-to-Click Ratio: Tracks the effectiveness of CTAs by identifying the percentage of viewers who click through to the target destination.
- Conversion Efficiency: Cross-references the engagement rate with final conversion goals to determine if the interaction actually led to a desired business outcome.
Official Perspective: The Growth Strategy
Stephen Ngo, who has been instrumental in the product’s strategic direction, notes that this update is part of a larger mission to democratize enterprise-level analytics. "My experience leading teams at Nira, Paddle, and ProfitWell taught me one thing: data is only as good as the decisions it leads to," says Ngo. "If you are testing two different offers on a CTA, you don’t care about the total number of people who saw it; you care about which offer was more persuasive. This update removes the manual math from that process, giving time back to the marketer to focus on creative strategy rather than spreadsheet reconciliation."
The move also signals Crazy Egg’s intent to maintain its competitive edge in a market crowded by generic analytics tools. By embedding these metrics directly into the workflow, they are effectively reducing the friction between analysis and execution.
Implications for Digital Marketing Teams
The implications for the industry are profound, particularly for teams operating with lean resources. Here is how this update changes the day-to-day workflow for marketers:
1. Refined A/B Testing Protocols
Previously, testing a new headline on a popup required a separate analysis period to calculate the percentage of success. With the new dashboard, marketers can see the real-time impact of a headline change on the engagement rate within minutes, allowing for faster iterative loops.
2. Eliminating "Zombie" Widgets
Many websites suffer from "widget clutter," where outdated popups continue to fire, annoying users without providing meaningful data. By reviewing the new engagement metrics, teams can quickly identify which widgets are failing to capture interest and prune their strategy accordingly.

3. Better Personalization Efforts
Understanding engagement rates allows teams to segment their audiences more effectively. If a CTA has a high engagement rate on mobile but a low one on desktop, the new metrics will surface this discrepancy immediately, prompting a responsive design fix.
4. Demonstrating ROI to Stakeholders
For agencies or internal growth teams, presenting "engagement rates" is often more persuasive than presenting "raw counts." It demonstrates a sophisticated understanding of conversion rate optimization (CRO) and highlights the team’s ability to improve the quality of traffic rather than just the volume.
Conclusion: The Path Forward
The integration of engagement rate metrics by Crazy Egg marks a maturation point for on-page widget analytics. By prioritizing the percentage of engagement over simple volume, the platform encourages a culture of optimization where every impression is treated as a learning opportunity.
As the digital landscape becomes increasingly noisy, the ability to capture attention without alienating users is a competitive advantage. With these new tools, Crazy Egg is positioning itself as an essential partner for growth-minded companies, providing not just the visibility to see what is happening on their sites, but the clarity to understand why it matters.
For the average marketer, the lesson is clear: Stop looking at the crowd and start looking at the conversion. As this feature continues to roll out, it will be interesting to see how it reshapes best practices for on-site messaging and user journey design in the coming year. Whether you are a solo entrepreneur or part of a global marketing team, the data is now, quite literally, at your fingertips.
