

Driving Digital Performance: The Essential Landing Page Metrics Every Marketer Must Track
Last Modified: March 19, 2025
In the dynamic realm of digital marketing, a landing page serves as the critical frontline of a brand’s online presence. Far from being just another web page, it is a precisely engineered gateway designed to capture visitor attention and guide them towards a specific, desired action. Much like a meticulously curated shop window entices passersby, a compelling landing page dictates whether a prospective customer steps inside your digital store or simply moves on. The stakes are high: millions are invested annually in driving traffic to these pages through sophisticated advertising campaigns, SEO strategies, and content marketing efforts. Without a robust system to measure their efficacy, these investments risk yielding suboptimal returns.
This article delves into the indispensable metrics that empower digital marketers to dissect user behavior, evaluate performance, and ultimately optimize their landing pages for maximum impact. Regardless of the analytics platform in use, understanding these key indicators is paramount to transforming casual visitors into valuable leads and loyal customers. We will explore the top 10 landing page metrics, offering a comprehensive guide to their calculation, interpretation, and strategic application.
Main Facts: The Indispensable Role of Landing Pages
A landing page is often the initial interaction point a user has with a brand’s specific campaign or offering. It’s a focused, standalone web page created for marketing or advertising campaigns. Unlike a typical webpage that might offer multiple distractions, a landing page has one singular purpose, known as a Call-to-Action (CTA). This singular focus makes it an incredibly powerful tool for lead generation, sales conversion, or information dissemination. However, its effectiveness is entirely dependent on its ability to resonate with the visitor and prompt the intended response. Failing to do so can result in a high "bounce rate," where visitors leave without engaging further, rendering all efforts to attract them futile. Therefore, meticulous tracking and continuous optimization of landing page performance are not merely advisable but absolutely essential for digital success.
Chronology: A Deep Dive into Key Performance Indicators
Understanding the journey a user takes on your landing page, from their arrival to their eventual action (or inaction), requires a systematic approach to data analysis. Here, we present the top 10 metrics, structured to guide you through this analytical process.

1. Traffic Sources: The Origin Story of Your Visitors
While not a metric in itself, analyzing traffic sources is foundational to understanding the context of all other metrics. It reveals where your visitors are coming from, providing crucial insights into the effectiveness of your various marketing channels.
Why it matters: Different sources often bring different types of audiences with varying levels of intent. For instance:
- Paid Search: Visitors often have high intent, actively searching for a solution.
- Paid Social: Visitors might be in discovery mode, less directly looking for a solution.
- Organic Search: Visitors are often researching, potentially in an earlier stage of the buyer journey.
- Email Marketing: These are typically existing leads or customers, often with higher trust and engagement.
- Referral Traffic: Visitors from other websites can be highly qualified if the referring site is relevant.
Implications: By segmenting your landing page metrics by traffic source, you can discern which channels are delivering the most engaged or convertible audience. If "Paid Search" campaigns are costing a significant amount but show a lower conversion rate compared to "Paid Social" for a particular landing page, it signals a need to re-evaluate your Paid Search targeting, ad copy, or even the landing page’s alignment with those specific ad campaigns. This insight enables strategic budget reallocation and campaign optimization, ensuring resources are directed towards the most effective channels.
2. Conversion Rate (CR): The Ultimate Measure of Success
The conversion rate is arguably the most critical metric for any landing page, directly measuring its ability to achieve its primary objective. A "conversion" can be anything from a form submission, a download, a newsletter subscription, to a product purchase.
Formula: (Total Conversions / Total Visitors) * 100
Supporting Data & Analysis:

- Defining Conversions: It’s vital to clearly define what constitutes a conversion for each specific landing page. This could involve macro-conversions (e.g., a sale) or micro-conversions (e.g., clicking a video, signing up for a demo).
- Segmentation: Analyze CR by various dimensions: traffic source, device type (mobile vs. desktop), geographic location, new vs. returning visitors, and even specific campaign parameters. This granular view helps pinpoint high-performing segments and identify areas for improvement. For example, if mobile users have a significantly lower CR, it suggests a need for mobile-specific design or content optimization.
- Benchmarking: While industry average conversion rates (often cited between 2-5% for e-commerce, but highly variable) offer a loose guide, it’s more beneficial to benchmark against your own historical performance or A/B test variations of the same page.
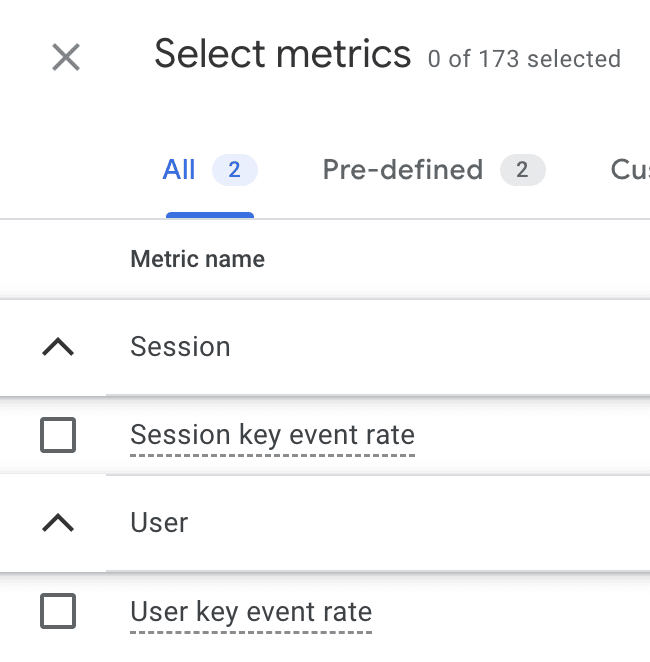
- GA4 Integration: Google Analytics 4 (GA4) tracks "Key Events," which are user interactions that contribute to your business goals. These can be configured as conversions, providing both "Session Conversion Rate" and "User Conversion Rate."
Implications: A high conversion rate indicates effective messaging, clear CTAs, and a seamless user experience. A low rate signals potential issues with the offer, clarity, trust elements, or page design. Continuous A/B testing of headlines, images, copy, and CTA buttons is crucial for improving CR.
3. Bounce Rate: The Engagement Barometer
Bounce rate measures the percentage of visitors who land on your page and leave without interacting further or navigating to another page on your site within the same session. It’s an initial indicator of immediate engagement (or lack thereof).
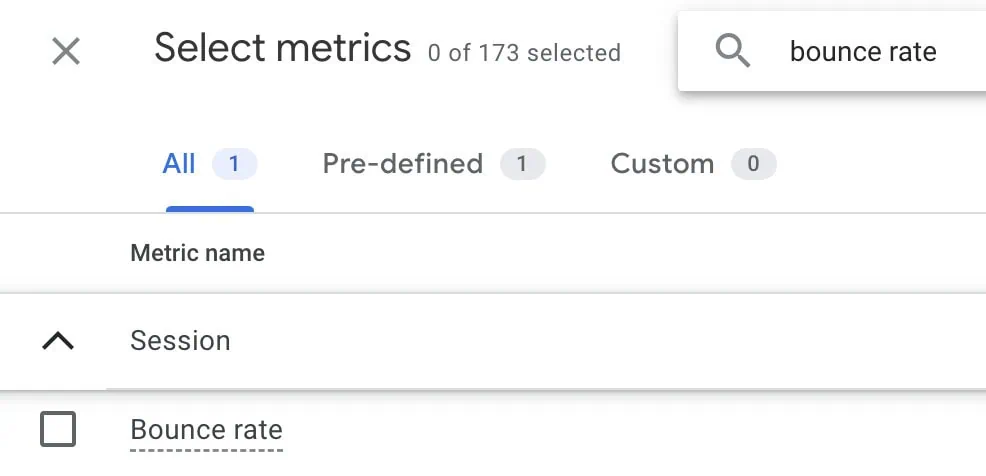
Formula: (Sessions with only one pageview / Total Sessions) * 100
Supporting Data & Analysis:
- Context is King: A high bounce rate isn’t always negative. For instance, if a landing page provides a phone number for direct contact, a user might find the information, call, and leave – a successful interaction from their perspective, but a "bounce" from an analytics standpoint. Conversely, a product page with a high bounce rate is usually a red flag.
- Common Causes of High Bounce Rates: Irrelevant content, slow page load times, poor mobile responsiveness, confusing navigation, broken links, or an overwhelming design can all contribute to visitors quickly abandoning a page.
- Industry Benchmarks: HubSpot suggests an average bounce rate between 26% and 70%, but this varies widely. Blog posts often have higher bounce rates (e.g., 65%) because users find their answer and leave. E-commerce product pages should aim for lower rates.
- Tracking Issues: Extremely low bounce rates (e.g., under 20%) or 0% might indicate incorrect analytics setup, such as duplicate tracking codes.
Implications: Identifying pages with consistently high, problematic bounce rates prompts investigation into content relevance, user experience, technical performance, and design elements. Optimizing these factors can significantly improve initial engagement.
4. Average Time on Page / Average Engagement Time: Depth of Interaction
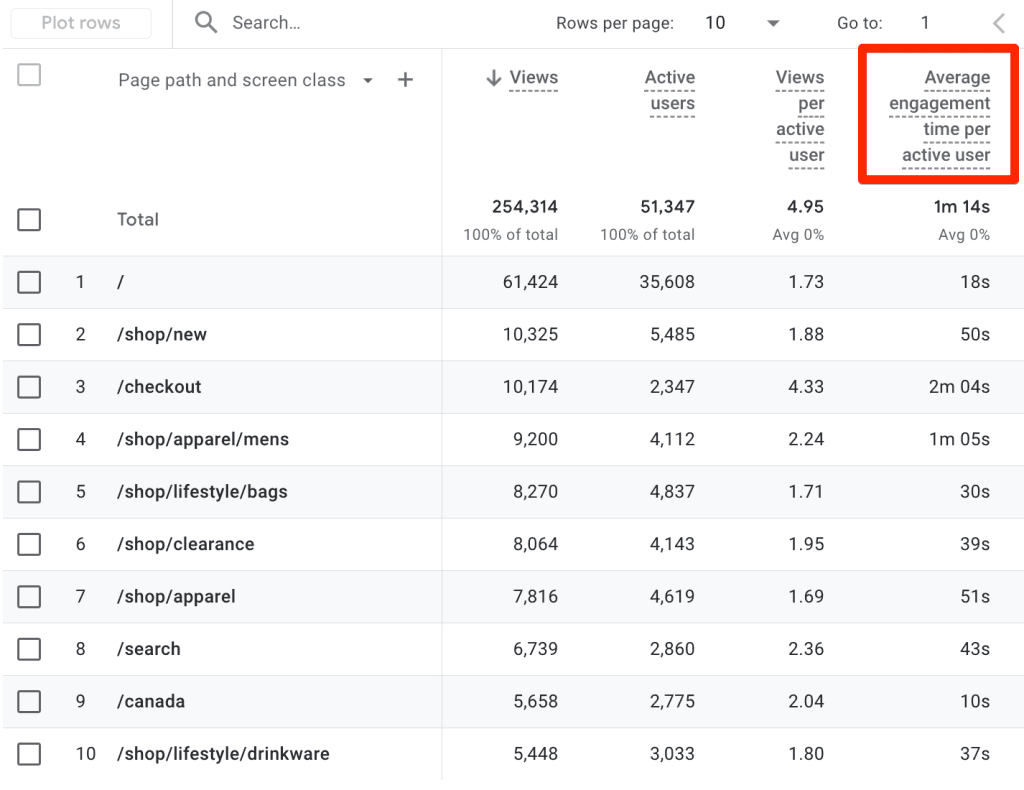
This metric indicates how long visitors typically spend on a specific landing page. In GA4, this has evolved into "Average Engagement Time," focusing on periods where users are actively interacting with the content.
Supporting Data & Analysis:
- Contextual Interpretation:
- High-Value Products/Services: Longer time on page is generally positive, suggesting users are carefully researching and considering their options.
- Long-Form Content (e.g., articles, detailed guides): A longer engagement time indicates users are consuming the content as intended.
- Simple Pages (e.g., lead capture forms): A short average time might be expected if the form is concise and the value proposition is clear. However, an unusually high time could signal confusion or technical issues with the form.
- GA4’s Average Engagement Time: This metric is more sophisticated than traditional "time on page," as it filters out idle time when a tab is open but not actively viewed. This provides a more accurate picture of active user engagement.
Implications: A low engagement time on pages intended for deep consumption suggests content isn’t compelling, is hard to read, or the page layout is confusing. For simple conversion pages, an excessively long time could point to friction points in the conversion process (e.g., a complicated form, unclear instructions). Analyzing this metric helps refine content strategy, improve readability, and streamline user flows.
5. Form Abandonment Rate: Uncovering Conversion Roadblocks
For landing pages designed specifically to capture information via forms, the form abandonment rate is a critical metric. It reveals the percentage of users who start filling out a form but do not complete it.
Formula: ((Number of users who started form - Number of users who completed form) / Number of users who started form) * 100
Supporting Data & Analysis:
- Identifying Friction Points: High form abandonment rates often indicate issues such as:
- Too Many Fields: Overly long or intrusive forms.
- Confusing Questions: Ambiguous or irrelevant information requests.
- Privacy Concerns: Lack of clear privacy statements or security badges.
- Technical Glitches: Form errors, slow submission times.
- Lack of Value: Users don’t perceive the value of submitting their information.
- Poor Mobile Experience: Forms that are difficult to navigate on smaller screens.
- Tracking: Specialized form analytics tools often provide detailed insights into field-level abandonment. In GA4, custom events can be set up to track form starts and completions, allowing for the calculation of this rate.
Implications: Optimizing forms based on abandonment data can significantly boost conversion rates. Strategies include reducing the number of fields, using conditional logic, providing inline validation, adding progress bars, ensuring mobile-friendliness, and reinforcing the value proposition of completing the form.
6. Cost Per Conversion (CPC): Measuring Marketing Efficiency
For landing pages driven by paid marketing campaigns, Cost Per Conversion (CPC) is an essential financial metric that directly links marketing spend to achieved outcomes.
Formula: Total Marketing Cost ($) / Total Conversions
Supporting Data & Analysis:
- Return on Investment (ROI): CPC is fundamental to evaluating the profitability of your campaigns. The goal is always for the cost per conversion to be significantly lower than the average value of a conversion (e.g., average order value, lead value).
- Campaign Optimization: By tracking CPC across different campaigns, ad groups, or keywords leading to the same landing page, marketers can identify inefficiencies and reallocate budget to more cost-effective strategies.
- Lifetime Value (LTV): For businesses with recurring revenue or repeat customers, comparing CPC to Customer Lifetime Value (CLTV) provides a more holistic view of long-term profitability. A higher CPC might be acceptable if the CLTV is also high.
- Benchmarking: CPC varies drastically by industry, product price, and conversion type. Regular monitoring against internal benchmarks and competitive analysis is key.
Implications: A high CPC indicates that your paid efforts are expensive relative to the conversions they generate, signaling a need to refine targeting, improve ad quality scores, optimize ad copy, or enhance the landing page’s conversion elements to improve its efficiency.
7. Exit Rate: Identifying Drop-Off Points in the User Journey
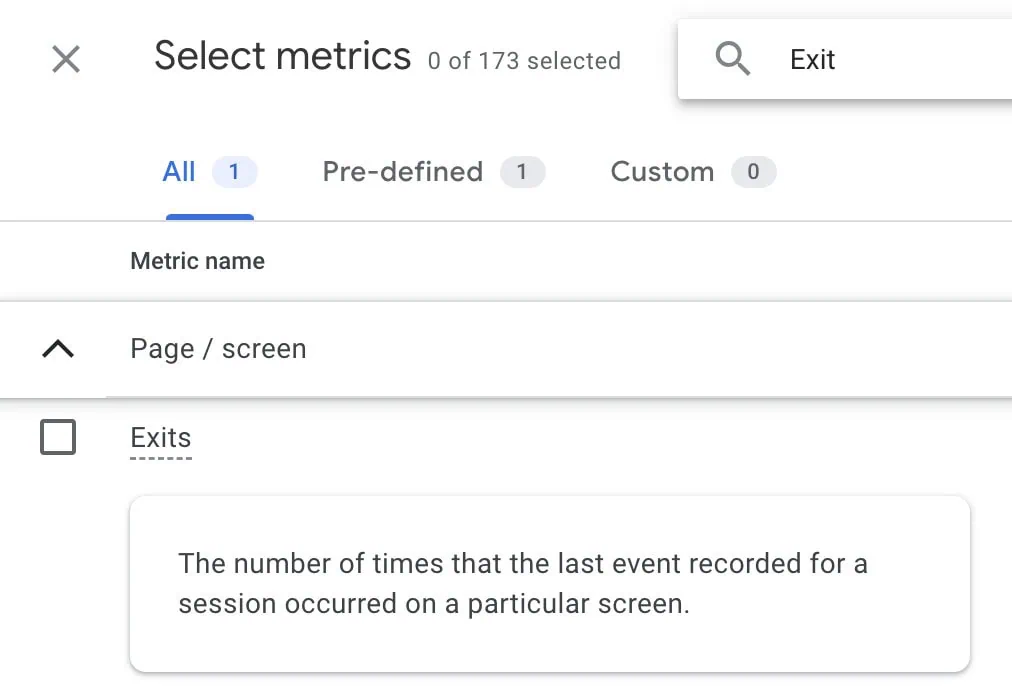
Often confused with bounce rate, the exit rate measures the percentage of all page views for a specific page that were the last in a session. Unlike bounce rate, which is only for single-page sessions, exit rate applies to any page where a session ends, regardless of how many pages the user visited prior.
Formula: (Number of Exits from Page / Total Pageviews for Page) * 100
Supporting Data & Analysis:
- Funnel Analysis: Exit rate is particularly valuable when analyzing multi-step funnels (e.g., checkout processes, multi-page forms). A high exit rate on a particular step indicates a bottleneck or point of frustration.
- Distinction from Bounce Rate: If a user lands on Page A, navigates to Page B, and then leaves, Page A’s bounce rate is 0%, but Page B’s exit rate will be higher.
- GA4 Availability: While GA4 provides the raw "Exits" metric, calculating the rate often requires creating a custom metric or exporting data to external tools like Google Sheets or Looker Studio.
Implications: A high exit rate on a landing page intended to drive users deeper into your site or funnel suggests that the page isn’t effectively guiding them to the next step. This could be due to a lack of clear CTAs, confusing content, or a perceived dead-end. Conversely, a high exit rate on a "thank you" page is usually desirable, as it signifies a completed conversion. Analyzing exit rates across sequential pages helps optimize the entire user journey.
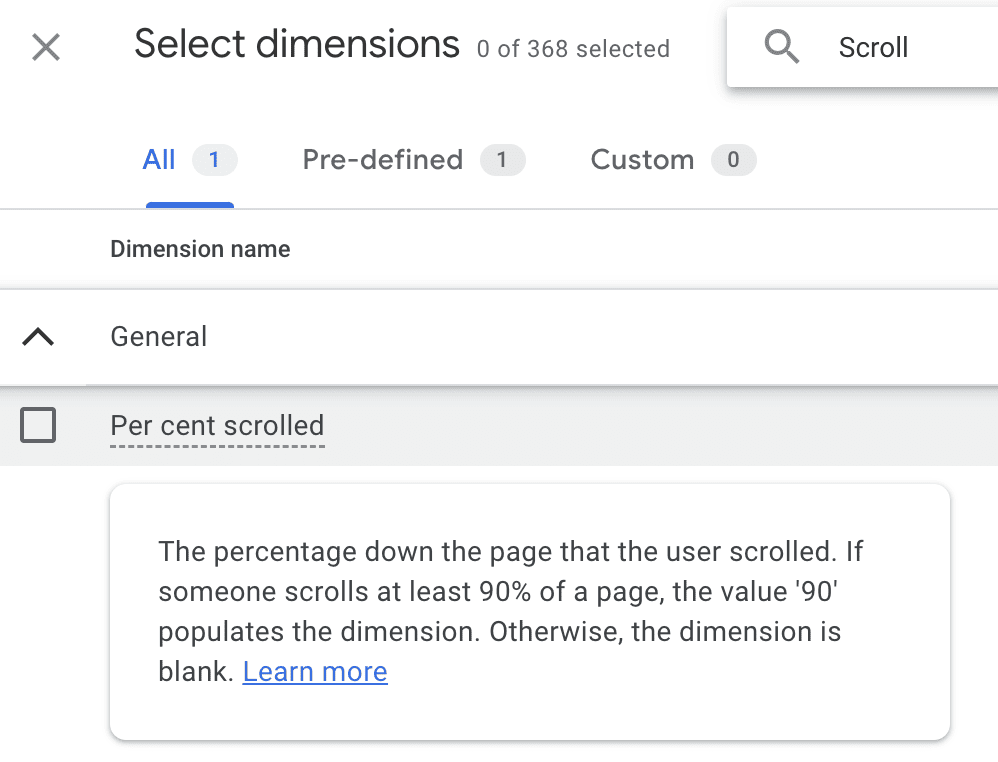
8. Scroll Depth: Unveiling Content Consumption
Scroll depth measures how far down a landing page visitors scroll. This engagement metric, typically expressed in percentages (e.g., 25%, 50%, 75%, 100%), reveals whether critical content, calls-to-action, or trust signals are being seen.
Supporting Data & Analysis:
- Critical Content Placement: If important information, persuasive arguments, or key CTAs are placed "below the fold" (requiring scrolling to be seen), scroll depth analysis confirms if visitors are reaching them.
- Content Engagement: For long-form landing pages, a high scroll depth indicates that users are genuinely interested in and consuming your content. Low scroll depth suggests content might be irrelevant, too dense, or poorly structured.
- Complementary Tools: Scroll depth data is incredibly powerful when combined with heatmaps and click maps (from tools like Hotjar or Clarity), which visually represent where users click, move their mouse, and how far they scroll.
- GA4 Integration: GA4 automatically tracks "scroll" events as dimensions, allowing you to see the percentage of users who scrolled to certain depths.
Implications: If users aren’t scrolling far enough to see essential elements, consider repositioning them "above the fold" or breaking up long content with more engaging visuals and subheadings. Conversely, if high scroll depth is observed, it validates the placement of detailed information lower on the page.
9. Click-Through Rate (CTR): The Lure of Your CTAs
Click-Through Rate (CTR) on a landing page measures the percentage of visitors who click on a specific element, such as a button, link, or image, out of the total times that element was visible (impressions). This focuses on internal CTR, distinct from the CTR of ads or search results leading to the landing page.
Formula: (Total Clicks on Element / Total Impressions of Element) * 100
Supporting Data & Analysis:
- CTA Effectiveness: CTR is a direct indicator of how compelling your calls-to-action (CTAs) are. This includes the text, design, color, placement, and surrounding copy.
- User Intent Alignment: A high CTR suggests that the element clicked aligns well with the user’s intent and expectations based on the page’s content.
- Identifying Issues: A sudden drop in CTR for a key element could signal a technical issue (e.g., a broken link, an unresponsive button) or a change in user perception.
- A/B Testing: CTR is a prime metric for A/B testing different CTA variations. Test different wording (e.g., "Learn More" vs. "Get Started"), colors, sizes, and positions.
Implications: Low CTR indicates that your interactive elements are not effectively encouraging users to take the next step. This requires reviewing the clarity, persuasiveness, and visual prominence of your CTAs. Ensure the offer is compelling and the pathway forward is unambiguous.
10. New vs. Returning Visitors: Tailoring the Experience
Analyzing the behavior of new versus returning visitors provides invaluable context for all other metrics. These are not metrics themselves but powerful dimensions for segmentation.
Supporting Data & Analysis:
- Behavioral Differences:
- New Visitors: Often in the awareness or consideration phase, they might have higher bounce rates and lower conversion rates as they are still evaluating your brand. Their primary need might be information and trust-building.
- Returning Visitors: These users have prior exposure to your brand, potentially higher intent, and might be closer to conversion. They might navigate more purposefully, have lower bounce rates, and higher conversion rates.
- Strategic Segmentation: By comparing conversion rates, engagement times, and bounce rates for these two groups, you can identify distinct user journeys and tailor your landing page experience accordingly. For example, a returning visitor might benefit from a personalized offer or a streamlined conversion path.
- Qualitative Analysis: Combine this data with qualitative tools like session recordings and heatmaps to observe how new and returning users interact differently. Do returning users scroll directly to the CTA? Do new users spend more time on introductory content?
Implications: Understanding the distinct needs and behaviors of new versus returning visitors allows for more targeted optimization strategies. You might design specific landing page variations, retargeting campaigns, or content pathways that cater to their unique positions in the customer journey, fostering trust for new users and accelerating conversions for returning ones.
Official Responses & Best Practices: A Holistic Approach to Optimization
The analysis of these metrics is not a standalone activity but an integral part of a continuous optimization cycle. Industry experts and successful digital marketers consistently advocate for a holistic approach:
- Define Clear Goals: Before designing any landing page, clearly articulate its primary conversion goal. This informs which metrics are most important to track.
- Benchmark Consistently: Establish internal benchmarks for your metrics and continuously strive to improve upon them. Industry averages are a starting point, not a definitive target.
- Segment Your Data: Always look beyond aggregate numbers. Segmenting by traffic source, device, audience type, and new vs. returning visitors unlocks deeper, more actionable insights.
- Embrace A/B Testing: Formulate hypotheses based on your metric analysis and test them rigorously using A/B or multivariate testing. This data-driven experimentation is the most reliable way to improve performance.
- Integrate Qualitative Tools: Quantitative data (numbers) tells you what is happening. Qualitative tools like heatmaps, scroll maps, session recordings (Hotjar, Microsoft Clarity), and user surveys tell you why it’s happening. Combining both offers a comprehensive understanding of user behavior.
- Iterate and Optimize: The digital landscape is ever-changing. Regularly review your landing page performance, adapt to new insights, and continuously refine your pages.
Implications: Transforming Data into Actionable Growth
The profound implication of diligent landing page metric tracking is the ability to move beyond guesswork and implement truly data-driven strategies. Each metric, when analyzed in context and in conjunction with others, provides a piece of the puzzle, revealing user intent, friction points, and opportunities for enhancement.
- Strategic Resource Allocation: Understanding which traffic sources deliver the most valuable conversions at the lowest cost enables smarter budget allocation across marketing channels.
- Enhanced User Experience (UX): Insights from bounce rate, average engagement time, scroll depth, and form abandonment highlight areas where the user journey is breaking down, leading to targeted UX improvements.
- Improved Conversion Rates: By systematically addressing issues identified through conversion rate, CTR, and form abandonment analysis, businesses can significantly increase their lead generation and sales.
- Higher Return on Investment (ROI): Optimizing Cost Per Conversion ensures that marketing spend translates into profitable outcomes, maximizing the return on every dollar invested.
- Personalized User Journeys: Differentiating between new and returning visitors allows for more personalized content and offers, leading to deeper engagement and higher conversion potential.
In conclusion, tracking these top 10 landing page metrics is not just about reporting numbers; it’s about fostering a culture of continuous learning and optimization. By embracing a data-centric approach, digital marketers can transform their landing pages from mere digital brochures into powerful conversion engines, driving sustainable growth and achieving measurable business objectives. The journey to a perfectly optimized landing page is ongoing, but with these metrics as your compass, you are well-equipped to navigate the complexities of the digital world.
