
Beyond the Spreadsheet: A Strategic Guide to Mastering Content Performance Analytics
If you believe that measuring content performance is simply a matter of glancing at a monthly report to see if your traffic numbers are "up or down," it is time to recalibrate your strategy. In the modern digital ecosystem, content performance is not a passive observation—it is a sophisticated, data-driven discipline that bridges the gap between creative output and tangible business growth.
Measuring the effectiveness of your content goes far beyond surface-level vanity metrics. It requires a structured, multi-layered approach, the precise selection of Key Performance Indicators (KPIs), a granular understanding of growth drivers, and a degree of technical acumen to ensure that data collection is accurate and actionable.
The Evolution of Content Measurement
To measure content performance effectively, you must first define the specific content ecosystem you are analyzing. The type of content you produce—whether it is high-funnel blog posts, bottom-funnel landing pages, or top-of-mind social media updates—will dictate the metrics that matter most.
While many KPIs share conceptual similarities across platforms, they often carry different labels. For instance, a "view" on a blog post and an "impression" on a social media ad represent different stages of the user journey. Once you have established your KPIs, the challenge shifts from tracking to interpreting. Simply monitoring the numbers is insufficient; you must contextualize them against historical trends and broader market benchmarks to extract real insights.
The Architecture of a Measurement Plan
Unless you are operating within a single, isolated tool, you need a centralized source of truth: the Measurement Plan. This document—which can be as simple as a structured Google Sheet—acts as the blueprint for your strategy. It should house your objectives, the specific KPIs tied to those objectives, your defined benchmarks, and your reporting cadence.
Categorizing Your Content
To prevent analysis paralysis, we recommend segmenting your efforts into three distinct buckets:
- Website Content: Owned assets like blogs, whitepapers, and product pages.
- Social Media Content: Platforms where you rent space to engage with an audience.
- Marketing Campaign Content: Targeted assets designed for specific, time-bound conversions.
Core Website Metrics
Website analytics remain the bedrock of content performance. Regardless of your CMS, you should be tracking the following:
- Active Users: The number of unique individuals engaging with your site.
- Page Views: The total volume of content consumption.
- Sessions: The frequency of user interaction within a defined time frame.
- Average Engagement Time: A vital metric for understanding if your content is actually being read or merely scanned.
- Events and Key Events: The specific actions (clicks, downloads, sign-ups) that correlate with your business goals.
- Revenue: The final indicator of content ROI.
Note: These metrics are not inherently captured. You must ensure your analytics stack—such as Google Analytics 4 (GA4) integrated via Google Tag Manager—is configured to track these specific user interactions from day one.
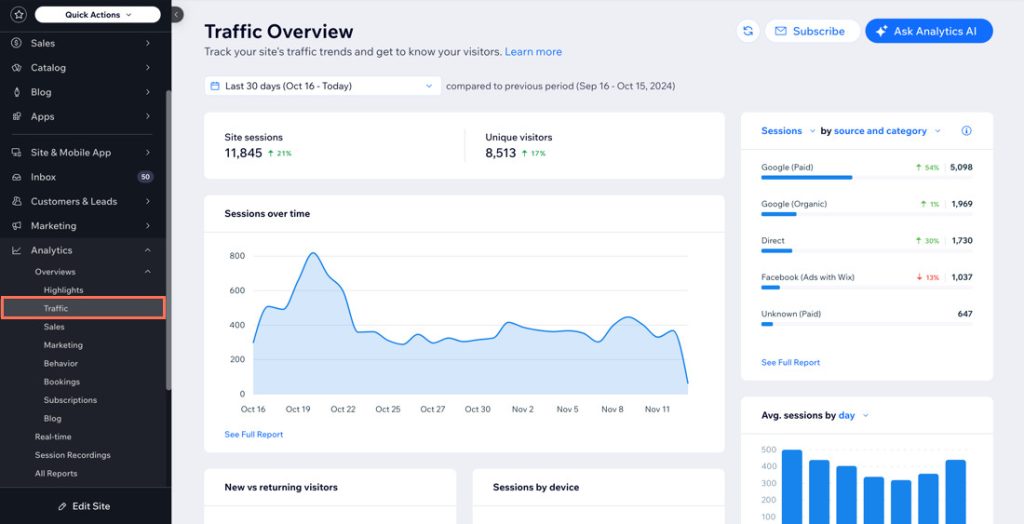
The Chronology of Performance Tracking
Effective measurement is not a snapshot; it is a timeline. To gain a true understanding of performance, you must follow a chronological evolution:
- Establishment (Baseline): Begin by collecting data to determine your average weekly and monthly performance. If your blog currently attracts 500 users per week, that is your baseline.
- Benchmarking (Internal vs. External): Once you have a baseline, you can set growth targets. If you aim for a 30% increase, your new target becomes 650 users per week. Once internal trends are established, shift your gaze externally to compare your performance against industry leaders and direct competitors.
- Scaling (Integration): As your operations grow, tracking platforms in silos becomes inefficient. This is the stage where you move from manual tracking to automated, integrated dashboards that provide a 360-degree view of your content ecosystem.
Leveraging Data for Competitive Advantage
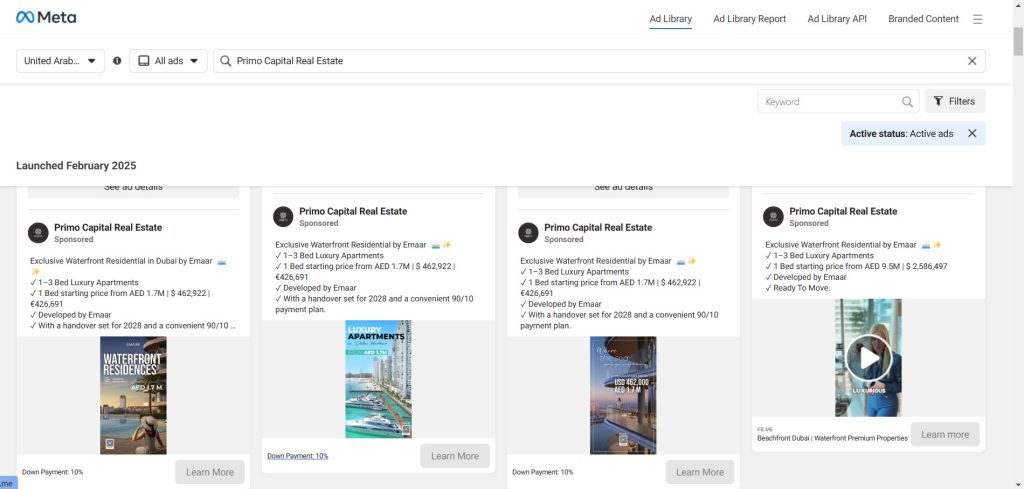
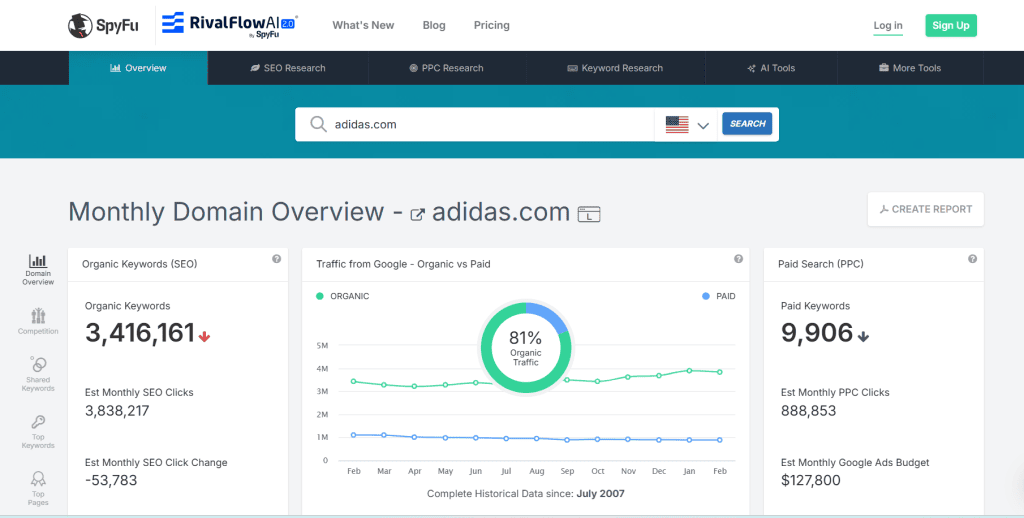
Benchmarking is the process of putting your data into context. By using competitive analysis tools like the Meta Ad Library or SpyFu, you can gain visibility into the strategies that your competitors are employing to win audience share.
For instance, by analyzing the ad creative and keywords of top-performing competitors, you can reverse-engineer their success. This level of intelligence allows you to pivot your content strategy before your competitors even realize their tactics are being scrutinized.
The Power of Reporting: From Built-in to Bespoke
Automation is the key to turning data into a tool for decision-making rather than a chore for the reporting team.
Utilizing Pre-made Reports
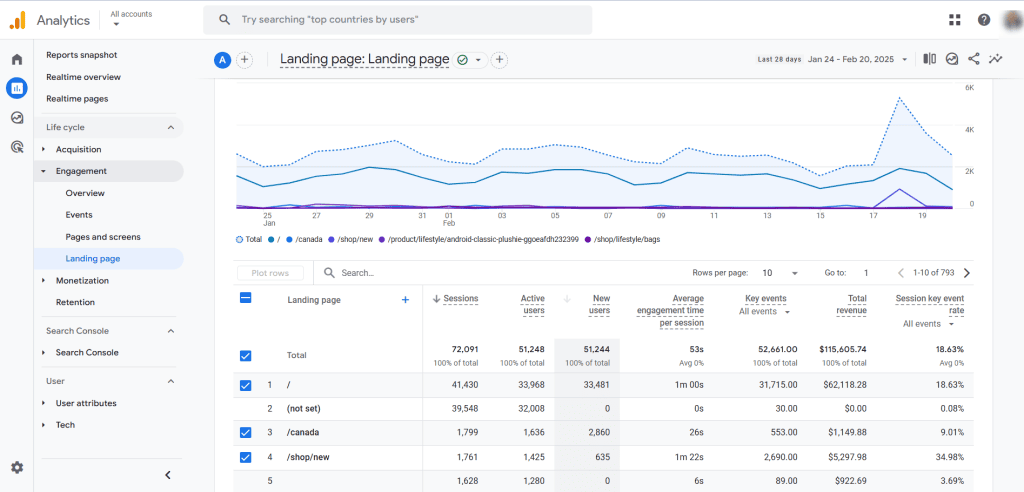
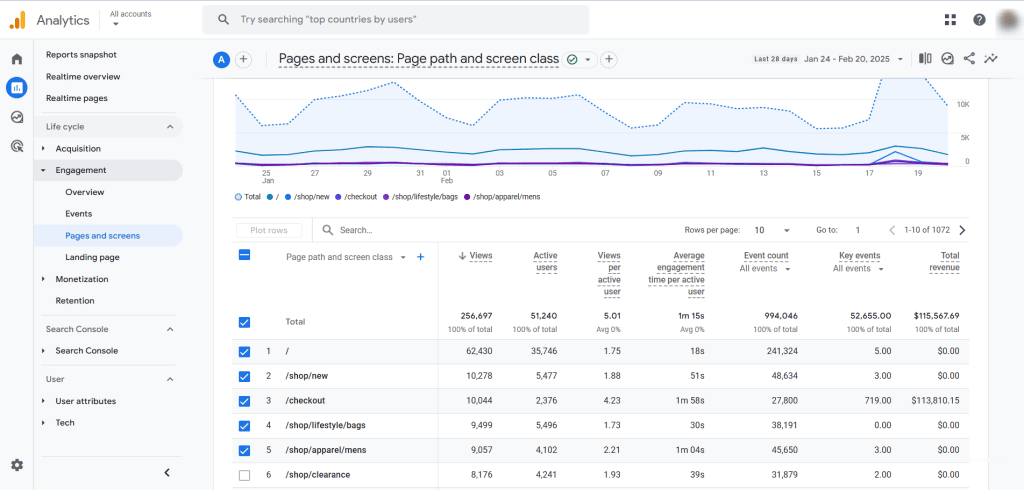
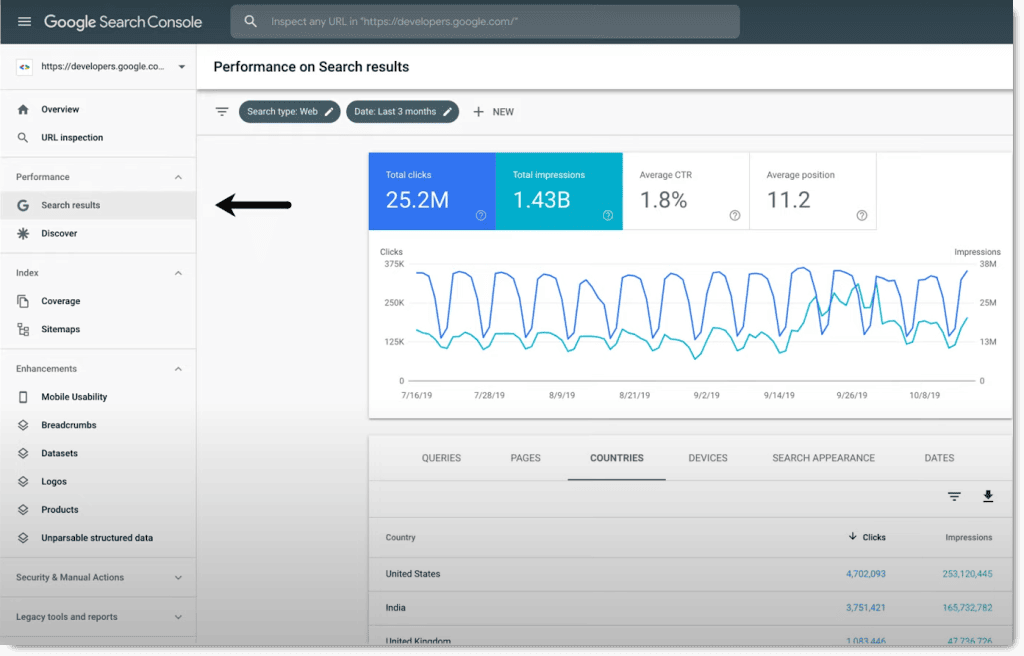
Most modern platforms, including CMS providers like Wix or analytics giants like Google, provide pre-configured reports. For websites, three reports are essential:
- The Landing Page Report: This is your digital front door. It identifies which pages drive your first impressions and sets the tone for the user experience.
- The Pages and Screens Report: This provides a bird’s-eye view of your most popular content across devices.
- The Performance Report (Search Console): This highlights the specific search queries that lead users to your site, allowing you to optimize content for intent rather than just keywords.
The Shift to Custom Explorations
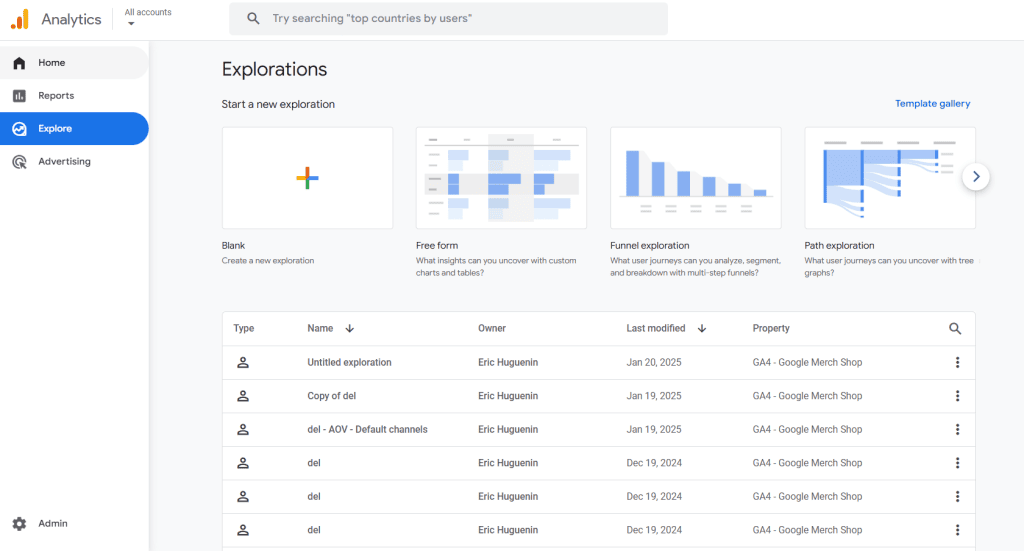
When standard reports no longer provide the depth you require, it is time for custom reporting. In GA4, "Explorations" allow for a flexible, drag-and-drop interface where you can mix and match dimensions and metrics to uncover hidden bottlenecks. For example, if you notice a "looping" behavior in a path exploration report—where users bounce back and forth between two pages—you have identified a clear navigation issue that needs immediate design intervention.
Multi-Channel Reporting: The Holistic View
As your marketing footprint expands across LinkedIn, email, search, and social, the danger of "siloed data" increases. A user might discover your content on a social platform, read a blog on your site, and eventually convert via an email newsletter. If you only look at each platform in isolation, you will fail to understand the actual customer journey.
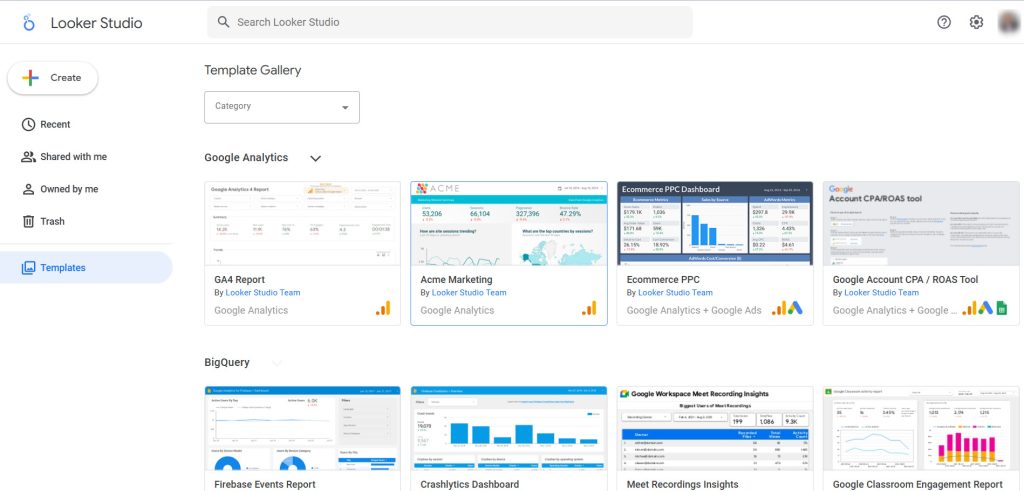
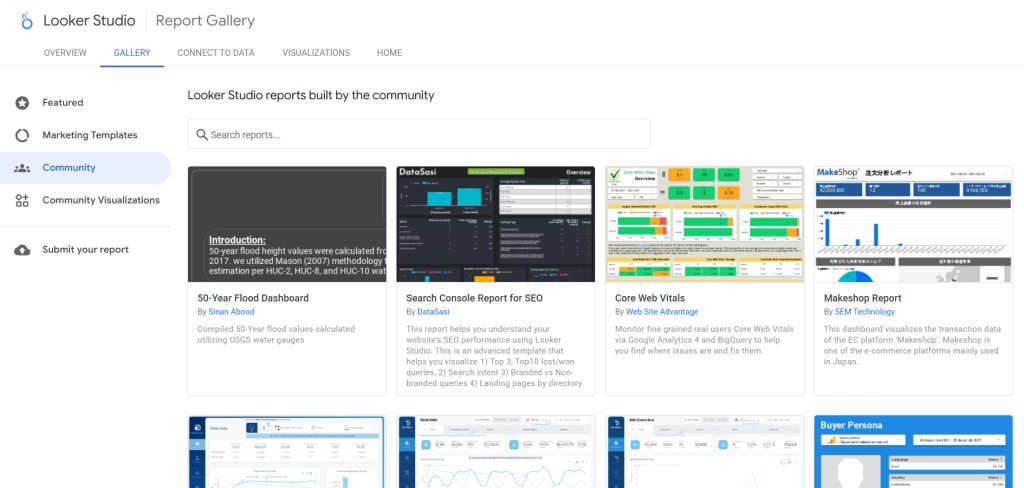
To solve this, organizations must employ multi-channel dashboards. By using data connectors like Supermetrics or Coupler.io, you can pipe data from disparate sources into visualization tools like Looker Studio, Tableau, or Power BI.
The Business Case for Automation
- Reduced Human Error: Manual data exports are prone to mistakes. Automated pipelines ensure data integrity.
- Speed to Insight: Real-time dashboards allow for mid-campaign course correction. If a specific creative is underperforming on social, you can pause it within hours rather than waiting for an end-of-month report.
- Strategic Focus: By automating the "what" (the numbers), your team can focus on the "why" (the strategy).
Implications for Future Strategy
The implications of a robust measurement framework are profound. When you move beyond vanity metrics, your content strategy shifts from "creating content to fill a calendar" to "creating content to move the business needle."
When you align your content types with specific, measurable KPIs, you can justify marketing budgets, demonstrate clear ROI to stakeholders, and allocate resources toward the formats and topics that genuinely resonate with your audience.
Summary: A Call to Data-Driven Action
Measuring content performance is not a one-size-fits-all process. It is a dynamic, evolving discipline that requires the right tools, a clear methodology, and the courage to act on what the data tells you—even when it contradicts your creative instincts.
From setting your initial baseline in a Google Sheet to building complex, multi-channel dashboards in Looker Studio, every step you take toward better measurement is a step toward greater efficiency. As you refine your framework, remember that the goal is not to track everything, but to track the things that drive your specific growth objectives.
What methods are you currently using to bridge the gap between content creation and performance measurement? Have you discovered a particular KPI that has revolutionized your strategy? We encourage you to share your experiences in the comments below; the most powerful insights often come from the collective experience of the community.
By committing to a data-driven approach, you ensure that your content strategy is not just a creative exercise, but a robust engine for long-term organizational success.
