
The Definitive Guide to Engagement Rate: Measuring Social Media Success in 2026
In the complex ecosystem of modern digital marketing, one metric remains the ultimate litmus test for content efficacy: Engagement Rate. As social media platforms continue to evolve their algorithms to prioritize meaningful interactions over passive consumption, understanding how to measure, analyze, and optimize your engagement rate is no longer a luxury—it is a business necessity.

Engagement rate acts as the bridge between raw reach and tangible brand affinity. It tells a story that impressions cannot: do your followers actually care about what you are saying? Whether you are a social media manager at an enterprise firm or an independent creator, mastering these metrics is the key to unlocking consistent growth and proving return on investment (ROI) to stakeholders.

The Fundamentals: What is Engagement Rate?
At its core, engagement rate is a social media metric that quantifies how actively your audience interacts with your content. It calculates the ratio of interactions—likes, comments, shares, saves, poll responses, and link clicks—against your audience size or reach.
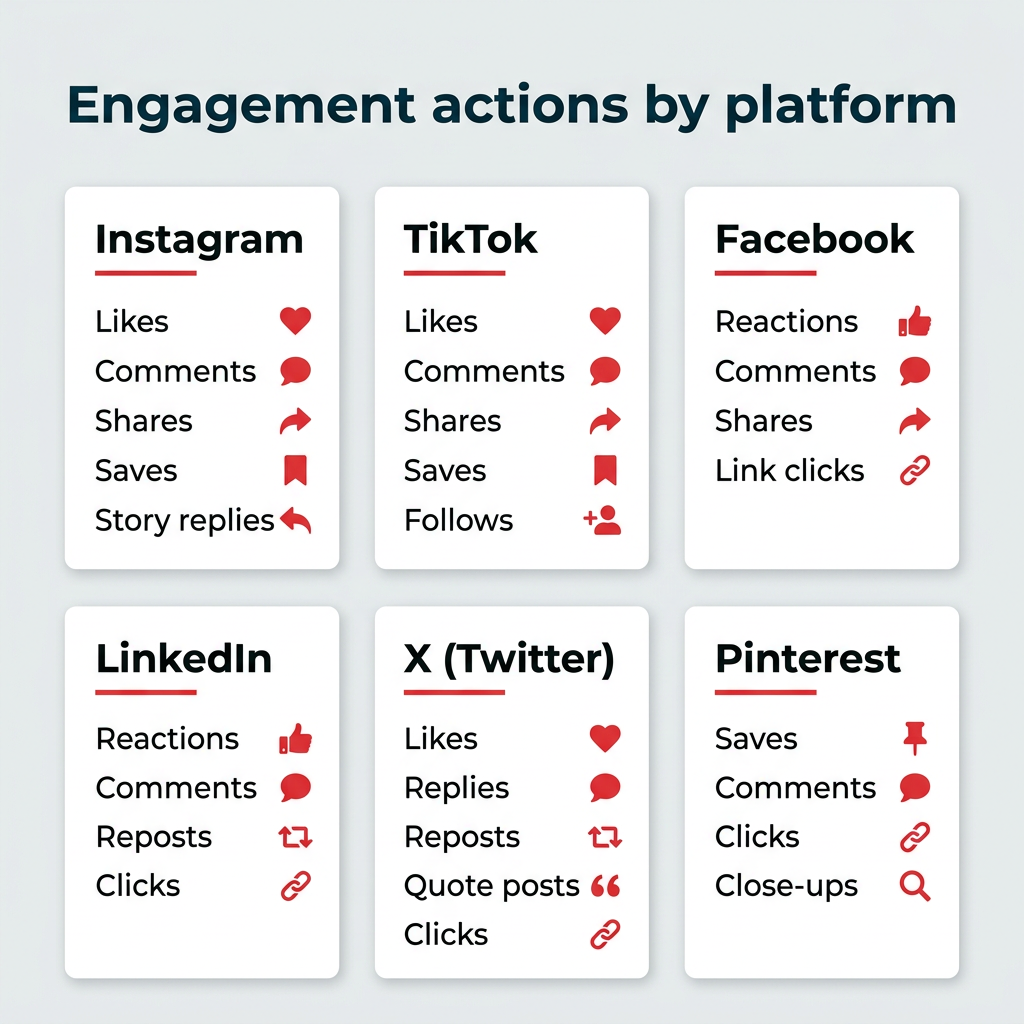
While "views" and "impressions" measure exposure (the passive act of seeing content), "engagement" measures connection. When a user pauses to leave a comment or shares a post to their own network, they are providing a clear signal of interest. For brands, high engagement is a leading indicator of brand loyalty and often triggers platform algorithms to amplify content to even wider, new audiences.
Why Engagement Rate Remains the Gold Standard
Engagement rate matters for three primary reasons:
- Algorithm Optimization: Social platforms prioritize content that sparks conversation. Higher engagement creates a virtuous cycle of increased visibility.
- Social Proof: High engagement rates serve as digital "word-of-mouth." First-time visitors to your profile are significantly more likely to follow a brand if they see an active, vibrant community in the comments section.
- Strategic ROI: For enterprise teams, engagement is the most reliable way to tie content performance to actual audience behavior, providing the hard data needed to justify budget allocations to leadership.
The Six Pillars of Calculation: Choosing Your Formula
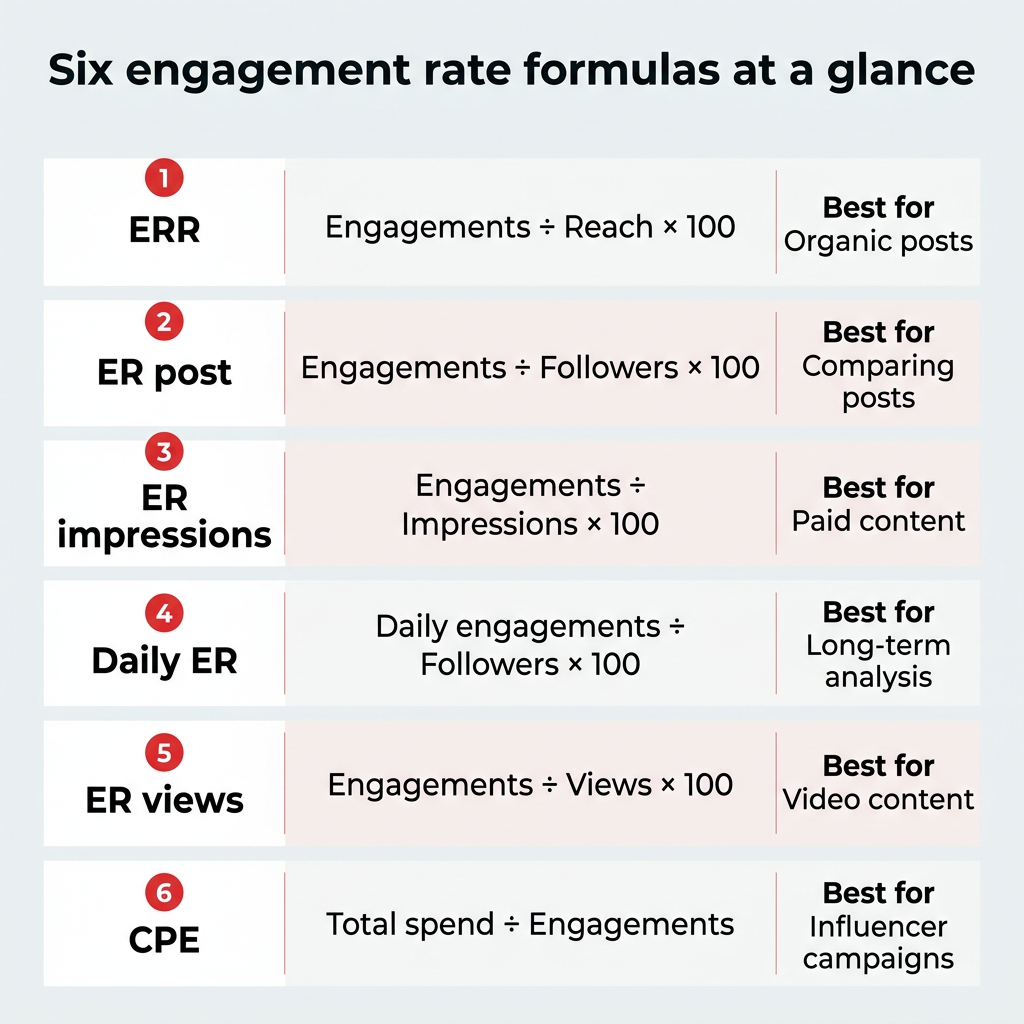
There is no "one-size-fits-all" formula. Depending on your goals—whether you are running a paid ad campaign or analyzing organic brand growth—different denominators will yield more accurate insights.
1. Engagement Rate by Reach (ERR)
The Industry Standard
ERR measures the percentage of people who interact with your content after seeing it. It is the most accurate metric for organic content because it accounts for the fact that not all followers see every post.

- Formula:
(Total Engagements / Total Reach) * 100
2. Engagement Rate by Post (ER Post)
The Influencer Metric
This formula compares engagement against your total follower count. It is the preferred method for influencers and brands looking to compare individual post performance over time.
- Formula:
(Total Engagements / Total Followers) * 100
3. Engagement Rate by Impressions (ER Impressions)
The Paid Campaign Benchmark
Impressions count every time content appears on a screen, even if the same user sees it multiple times. This is the most effective way to measure paid advertising efficiency, particularly under a Cost-Per-Thousand (CPM) model.

- Formula:
(Total Engagements / Total Impressions) * 100
4. Daily Engagement Rate (Daily ER)
The Long-Term Analysis
This tracks how often your followers interact with your account on an average day, accounting for all content—including older posts that may still be generating comments.
- Formula:
(Total Engagements in a Day / Total Followers) * 100
5. Engagement Rate by Views (ER Views)
The Video Specialist
Essential for TikTok, Reels, and YouTube, this measures interaction relative to the number of people who watched your video.
- Formula:
(Total Engagements on Video / Total Video Views) * 100
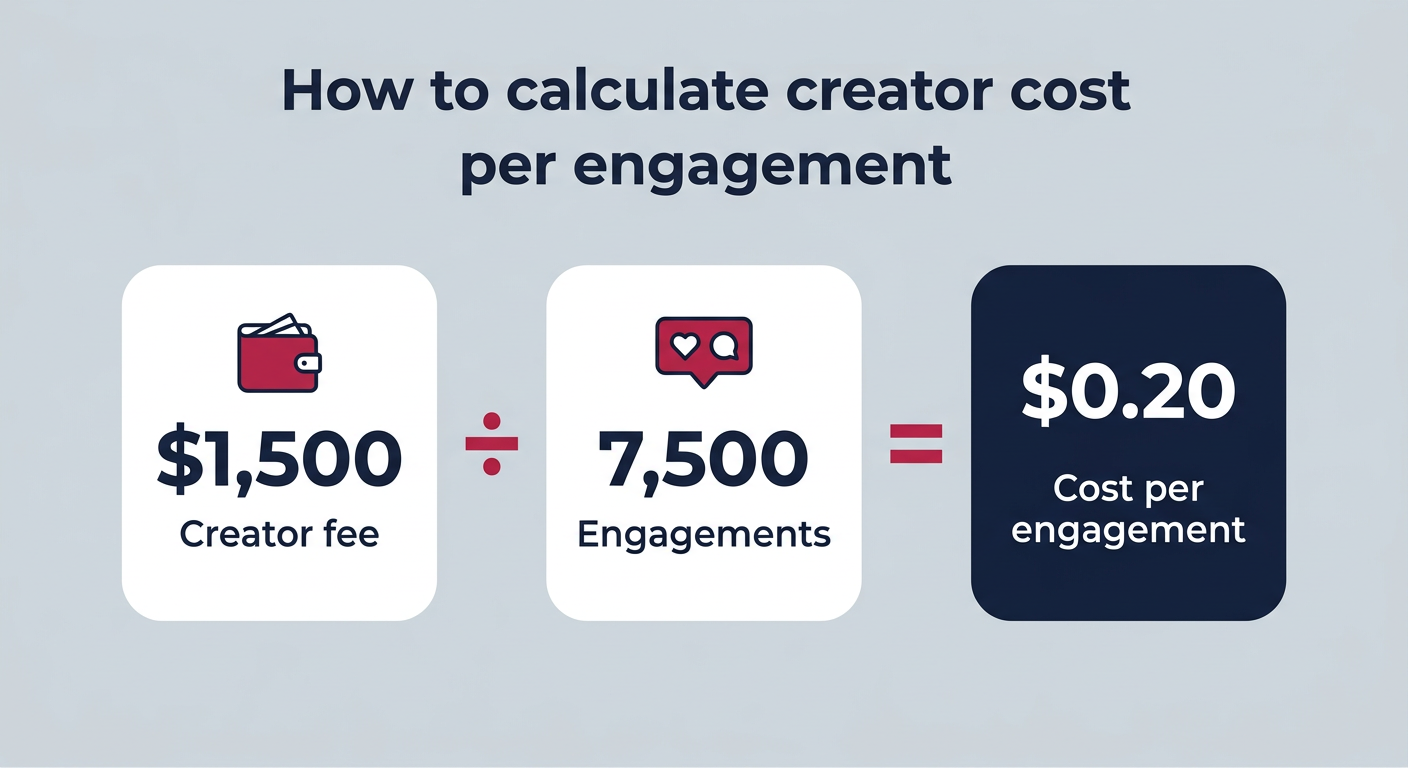
6. Cost Per Engagement (CPE)
The Financial Bottom Line
CPE calculates the monetary efficiency of a campaign. It is vital for influencer partnerships where you need to compare the "price tag" of a creator against the actual interaction they generated.
- Formula:
Total Spend / Total Engagements
Benchmarks for 2026: What is a "Good" Rate?
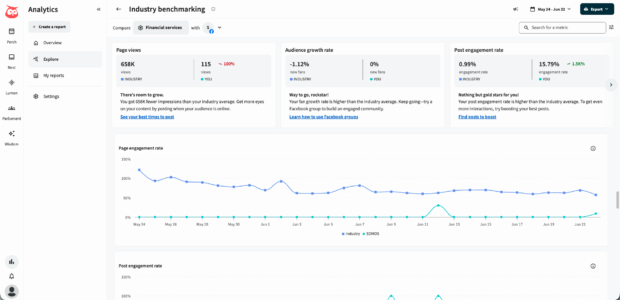
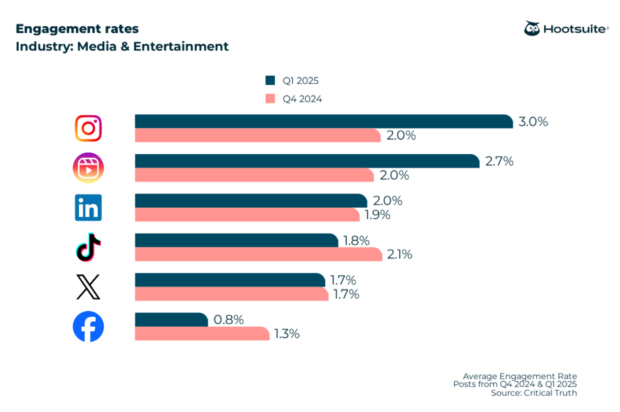
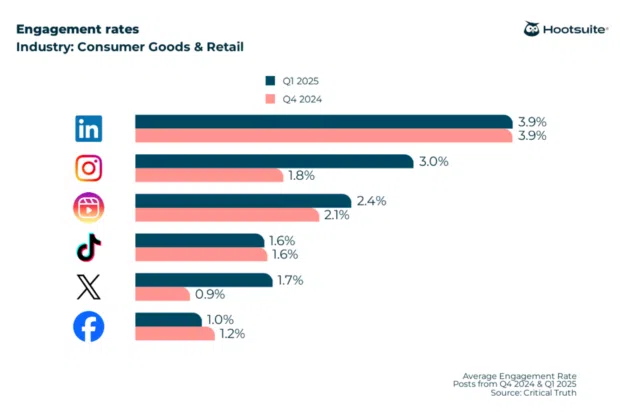
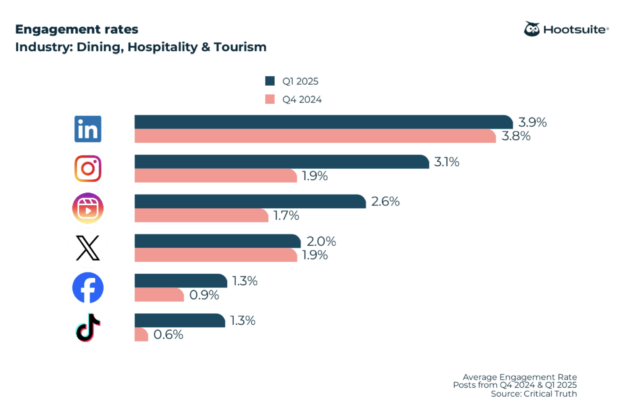
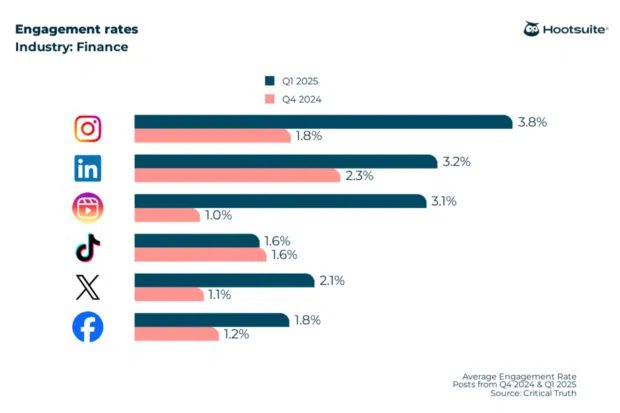
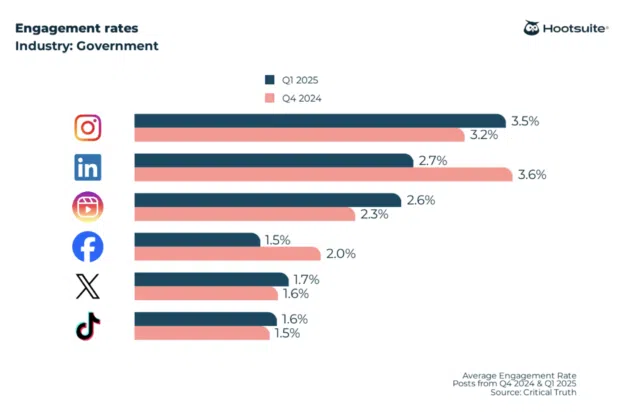
Understanding your data requires context. According to 2026 industry analysis, a "good" engagement rate generally falls between 1% and 5%. However, these figures vary drastically by platform and industry.
| Platform | Best-Performing Content Type | Average Engagement Rate |
|---|---|---|
| Carousels | 4.2% | |
| Videos | 3.9% | |
| Albums | 2.9% | |
| X (Twitter) | Status Updates | 1.8% |
| TikTok | Videos | 1.5% |
Sector-Specific Insights
- Nonprofits: Often see the highest engagement, particularly on Instagram (5.5%), driven by mission-aligned audiences who are naturally inclined to share.
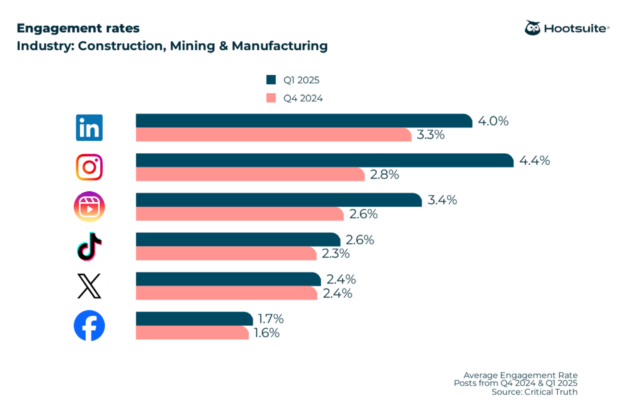
- Construction & Manufacturing: These sectors see surprisingly strong LinkedIn performance (often exceeding 4%) because their audience is comprised of professionals using the platform as a primary business tool.
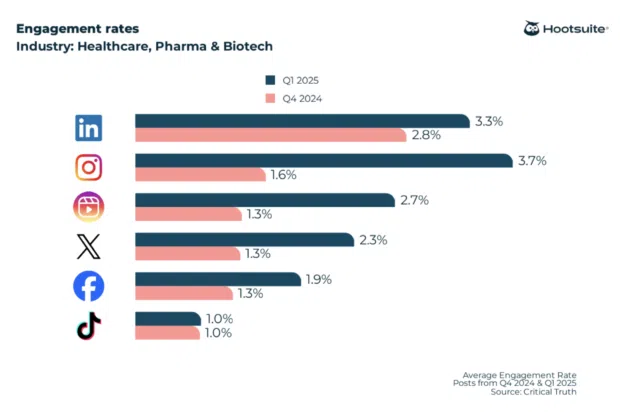
- Healthcare: Faces unique hurdles due to regulatory and privacy constraints, leading to lower engagement on platforms like TikTok (approx. 1%), where informal content is prioritized.
Common Pitfalls: Why Your Data Might Be Misleading
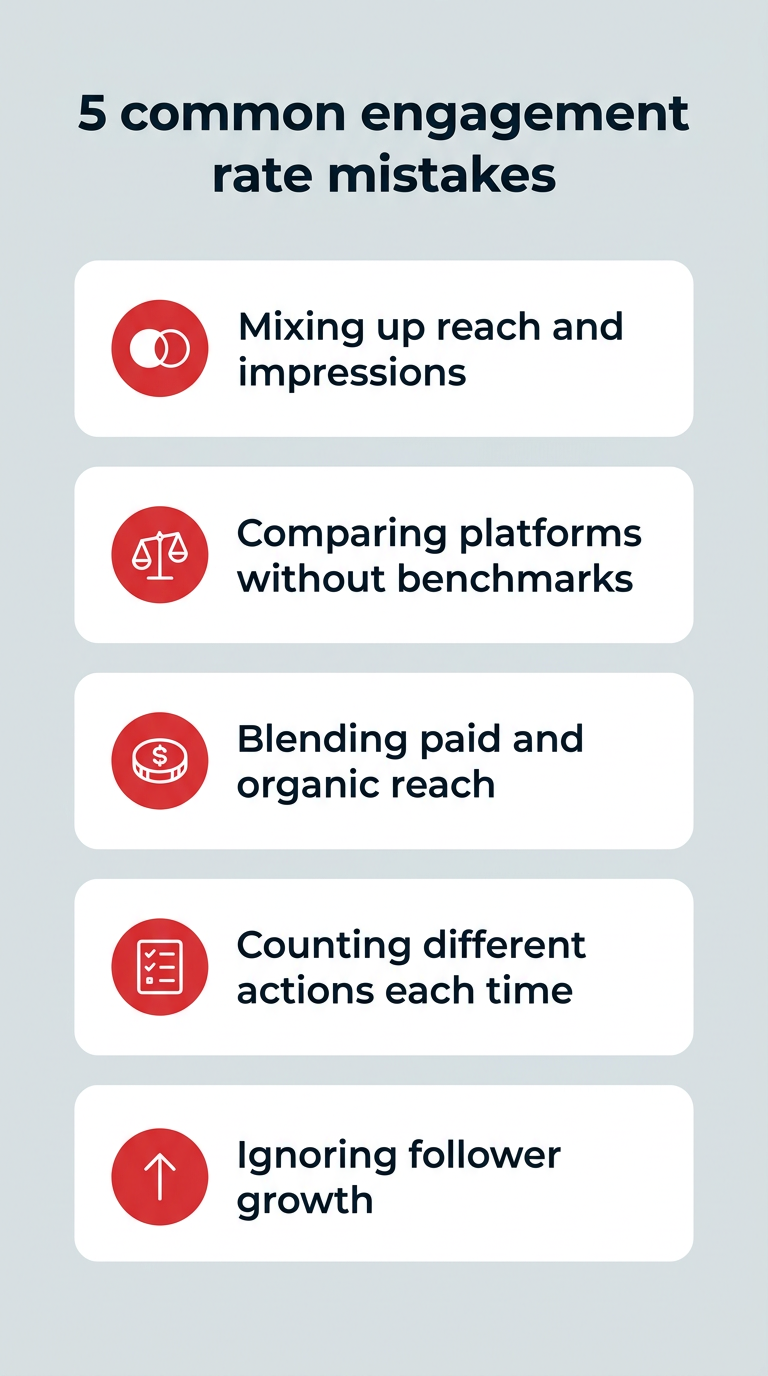
Many marketing teams struggle with "vanity metrics" or inconsistent reporting. Before presenting your findings, ensure you are avoiding these five common mistakes:
- Inconsistent Definitions: Ensure every member of your team agrees on what counts as an "engagement." Does a "link click" count? Does a "view" count? Consistency is more important than the specific choice.
- Ignoring Reach Fluctuations: If your reach drops significantly, your engagement rate might spike artificially. Always look at raw engagement numbers alongside the percentage.
- Mixing Platforms: Never compare a TikTok engagement rate directly to a LinkedIn rate. The user behaviors on these platforms are fundamentally different.
- Omitting Paid vs. Organic: Always segment your data. Paid content will naturally have different performance drivers than organic posts.
- Focusing on One Post: A single viral post can skew your monthly average. Always analyze trends over a rolling 30-day or 90-day period.
Implications: Turning Data into Strategy
Data without action is just noise. Once you have calculated your engagement rates, you should use them as an input for your broader social strategy.
- Content Planning: If your data shows that "Video" outperforms "Static Images" on LinkedIn, shift your production budget to favor video.
- Community Management: If your engagement spikes on Tuesdays at 10 AM, adjust your scheduling calendar to align with your audience’s peak availability.
- Influencer Selection: When vetting partners, look at their historical CPE (Cost Per Engagement) rather than their follower count. A smaller creator with a 6% engagement rate is often a better investment than a celebrity with a 0.5% rate.
- Product Development: Use the "comments" and "saves" as qualitative data. If users are constantly asking about a specific feature in the comments, you have identified a market need that can inform future product roadmaps.
Conclusion: The Path Forward
The goal of measuring engagement rate is not to chase a higher number for its own sake, but to create a more meaningful connection with your audience. As we move further into 2026, the brands that win will be those that stop treating social media as a broadcast channel and start treating it as a conversation.
By leveraging analytics tools to automate the math, you free up your team to do what they do best: tell stories that resonate, answer questions that matter, and build a community that lasts. Start by calculating your baseline, compare it against the industry benchmarks provided here, and begin the iterative process of testing, learning, and optimizing. Your audience is talking—the only question is: are you measuring the impact of the conversation?
