
Demystifying User Metrics: A Deep Dive into Unique Visitors in Google Analytics 4
Last Modified: March 26, 2025
In the vast and often perplexing landscape of web analytics, terms like "total users," "active users," "new users," "returning users," "sessions," and countless other metrics can quickly overwhelm even seasoned digital strategists. The sheer volume and nuanced definitions often lead to confusion, making meaningful analysis a significant challenge. Crucially, what one analytics platform defines as a "metric" can differ substantially from another, underscoring the necessity of a precise understanding of each term within its specific context.
At the heart of measuring website performance lies the concept of "visitors." Historically, "unique visitors" served as a foundational metric, offering a straightforward count of individual users interacting with a site. However, with the advent of Google Analytics 4 (GA4), the terminology and underlying methodologies have evolved, presenting a more sophisticated, albeit initially complex, approach to user identification. This comprehensive guide will plunge into the specifics of how GA4 conceptualizes and tracks unique visitors, illuminating its core definitions, tracking mechanisms, reporting capabilities, best practices for data utilization, and crucial limitations.
The Evolving Definition of a "Unique Visitor" in GA4
In Google Analytics 4, the direct metric "unique visitor" as understood in Universal Analytics no longer explicitly exists. Instead, GA4 introduces a more nuanced framework centered around "Total users" and "Active users," which serve as the primary proxies for unique individuals interacting with your website or app. Understanding these distinctions is paramount for accurate data interpretation.
Decoding Total Users and Active Users
Total Users are defined by Google as unique users who trigger any event on your site or app within a specified date range. The criteria for an event to be triggered are diverse; however, a fundamental event like a page_view will automatically register a unique user. Custom events, tailored to specific business objectives, come with their own trigger conditions, such as a "sign_up" event firing upon successful form submission. This metric offers the broadest count of individuals who have interacted with your digital property in any capacity.
Active Users, on the other hand, represent a more engaged segment of your audience. A user is considered "active" if they have an engaged session or if GA4 collects any of the following specific events: engagement_time_milli (indicating active time), scroll (indicating content consumption), or first_visit (for new users). The emphasis here is on demonstrating a more substantive interaction than merely triggering any event.

The concept of an engaged session is key to defining an active user. A session is deemed engaged if a user meets any of the following conditions:
- The session lasts for 10 seconds or longer.
- The session includes one or more conversion events.
- The session includes two or more page or screen views.
This definition suggests that nearly all users who spend any meaningful time on your site will likely be classified as active. Indeed, data often shows a close correlation between Total Users and Active Users, as illustrated in the provided example:
(Insert Image: Total users and active users comparison in GA4)
While GA4’s standard reports often favor Active Users, both metrics offer valuable insights. The choice between them often depends on the specific analytical goal – whether you seek the broadest reach (Total Users) or a more qualified, engaged audience (Active Users). Minor discrepancies between these two metrics can arise from factors such as session timeouts, the timing of event triggers, or differences in how user consent is managed across different interactions.
Beyond Uniqueness: New and Returning Users
GA4 also categorizes users as "New" or "Returning," providing essential insights into audience acquisition and retention.
- New Users: These are individuals who visit your site or app for the first time within the selected date range.
- Returning Users: These are individuals who have visited your site or app previously within the selected date range.
It’s crucial to understand a key nuance: a single user can be counted in both the "New Users" and "Returning Users" metrics if your selected date range spans their first visit and a subsequent visit. For example, if a user first visits on March 2nd and returns on March 7th, and your report covers March 1st to March 10th, they will appear in both categories. This means "New Users" and "Returning Users" are not mutually exclusive and should not be summed to equal "Total Users" or "Active Users." They offer distinct perspectives on user behavior: new users highlight acquisition success, while returning users underscore loyalty and retention.
The Mechanism: How GA4 Identifies Users
Understanding how Google Analytics 4 tracks and identifies users is fundamental to interpreting your data accurately. GA4 employs a multi-faceted approach, moving beyond the simpler, cookie-dependent methods of its predecessor.
The Client ID: A Digital Fingerprint
At its core, for web properties, GA4 primarily relies on a Client ID (CID), also known as cid, to identify unique browsers or devices. This unique identifier is stored within a first-party cookie named _ga in the visitor’s browser. When a new user lands on your site, GA4 generates a random Client ID and assigns it to them, allowing the platform to distinguish repeat visits from the same browser/device.
A Client ID typically appears as a string like 1242591205.1741664478. The first part is a randomly generated number, while the second part, following the period, represents the creation timestamp of the Client ID in UNIX format. By default, this _ga cookie has a 2-year expiration time, but this can be adjusted within the GA4 interface to comply with privacy regulations, with options ranging from 0 (session-based) to 25 months.
It’s vital to differentiate the Client ID from a User ID. The Client ID is browser and device-specific; it cannot track a single user across different browsers or devices. If a user visits your site on a desktop and then later on a mobile phone, they will be assigned two different Client IDs and thus counted as two separate unique users by default. A User ID, on the other hand, is a persistent, non-personally identifiable ID that you can assign to logged-in users, enabling cross-device and cross-platform tracking for truly unique individual identification.
User Identification Methods in GA4
GA4 uses a flexible, hierarchical approach to user identification, aiming for the most comprehensive and privacy-safe view of your users:
- User-ID: This is the most accurate method. When you implement User-ID, GA4 uses your own unique identifiers for logged-in users, allowing it to stitch together data from various devices and browsers to represent a single individual.
- Google Signals: If User-ID is not present, GA4 attempts to use Google Signals. This feature leverages data from users who are signed in to their Google accounts and have opted in to Ads Personalization. It provides cross-device capabilities and demographic insights while respecting user privacy settings.
- Device ID: For app data streams, GA4 primarily relies on the App instance ID (on Android) or the Instance ID (on iOS) to identify unique app installations.
- Client ID: As discussed, this is the default method for web data streams when no other higher-priority identification method is available.
GA4 attempts to use the highest available identification method in this hierarchy, falling back to lower methods if the higher ones are not present or applicable. This blended approach offers a more robust understanding of user journeys than previous analytics platforms.
The Impact of Privacy and Browser Technologies
The effectiveness of Client ID-based tracking is increasingly influenced by evolving privacy regulations and browser technologies. Modern browsers, particularly those with advanced privacy features like Apple’s Intelligent Tracking Prevention (ITP) in Safari and Enhanced Tracking Protection (ETP) in Firefox, place strict limitations on the lifespan of first-party cookies. These technologies can drastically reduce the default 2-year cookie expiration to as little as 7 days, or even 24 hours in some scenarios.
The consequence of these limitations is significant: if a user returns to your site after their _ga cookie has expired or been deleted by their browser, they will be assigned a new Client ID and counted as a "new user," even if they are the same physical individual. This can inflate your "new user" counts and distort the accuracy of your "returning user" and overall "unique user" metrics. Furthermore, ad blockers and certain browser extensions can prevent tracking scripts from firing altogether, leading to undercounted users and incomplete data.
Navigating GA4 Reports: Locating User Metrics
One of GA4’s strengths is its ubiquitous integration of user metrics across various reports. While "Active users" is often the default, "Total users," "New users," and "Returning users" are readily available, providing diverse perspectives on your audience.
Here are some key locations within GA4’s standard reports where you can find these vital user metrics:
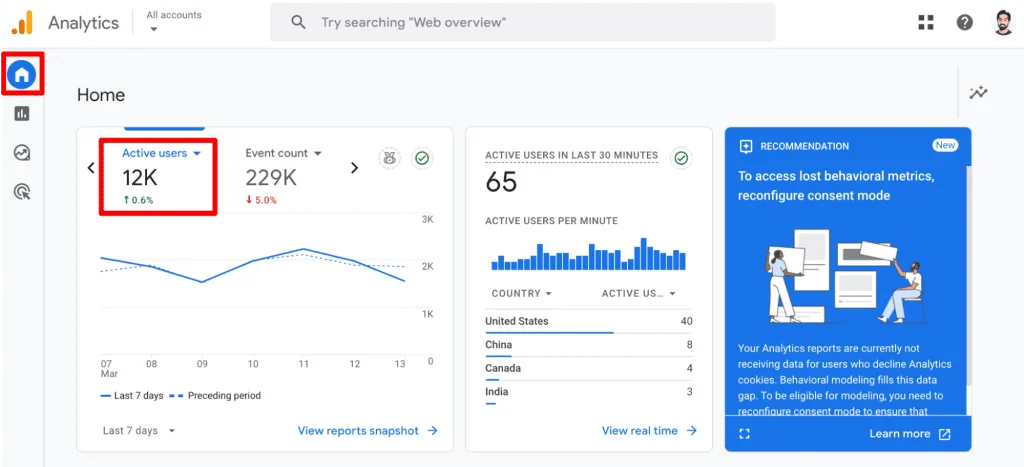
- Home Report: Offers a quick overview of Active users compared to previous periods, providing a real-time pulse check on recent engagement.
- Reports snapshot: Presents a summary of Active and New users, along with immediate insights into user demographics and acquisition channels.
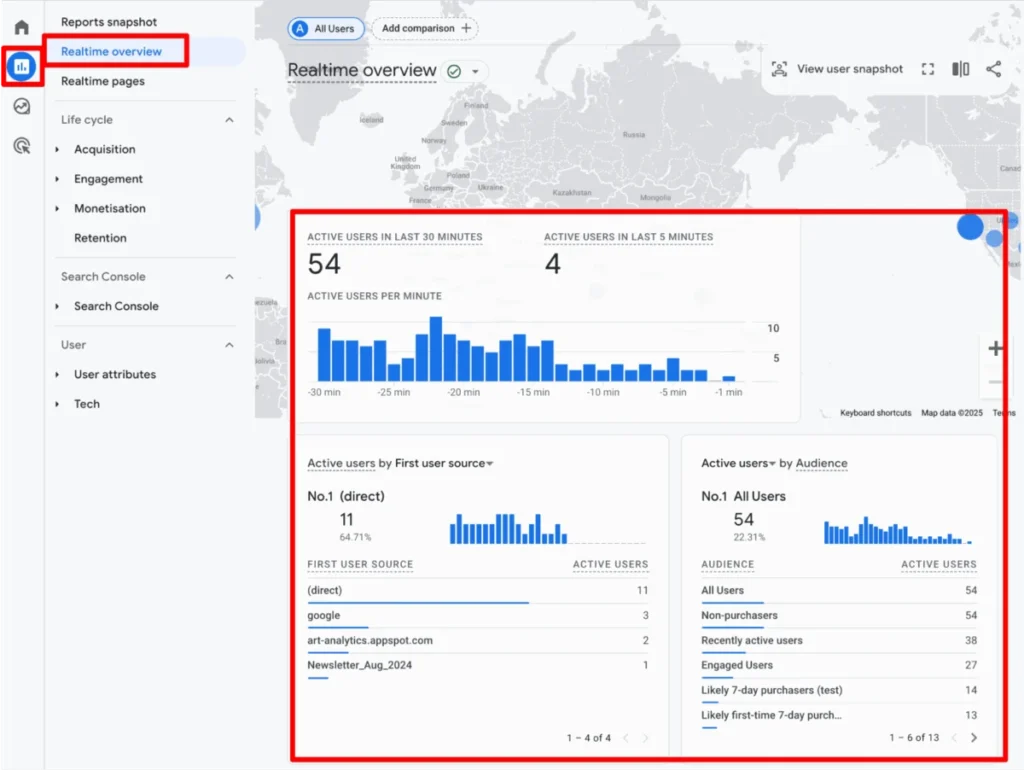
- Realtime overview: Displays current Active users on your site or app within the last 30 minutes, ideal for monitoring immediate impact.
- Realtime pages: Similar to the overview, this report lists the specific pages where Active users are currently engaged, offering granular real-time content performance.
- Acquisition → Overview cards: Summarizes Active and New users, indicating how effectively you’re drawing new audiences and retaining current ones.
- User acquisition: Provides detailed data on Total, New, and Returning users by source, medium, and campaign, essential for evaluating marketing efforts.
- User acquisition cohorts: Focuses on New users and their retention over time, revealing the long-term value of different acquisition channels.
- Engagement → Overview cards: Highlights Active users and their engagement patterns, such as average session duration and engaged sessions per user.
- Events: Shows Total users who triggered specific events, helping to understand the reach of key interactions.
- Pages and Screens: Displays Active users for individual pages or app screens, indicating content popularity and engagement.
- Landing pages: Lists Active and New users by the page they first entered your site, crucial for optimizing entry points.
- eCommerce → Purchase and Checkout journey: Tracks Active users through critical conversion funnels, identifying drop-off points.
- Retention: Analyzes New and Returning users over time, providing insights into user loyalty and churn.
- User attributes → Overview cards: Summarizes Active users based on various demographic and technical attributes.
- User attributes → Demographic details: Offers detailed breakdowns of Active and New users by age, gender, and interests.
- User attributes → Audiences: Shows New and Total users within defined audience segments, useful for targeted analysis.
- Tech → Overview cards: Displays Active users based on the technology they use (browser, device, OS).
- Tech → Tech details: Provides granular data on Active and New users by specific technological dimensions.
Beyond these standard reports, GA4’s Explorations feature offers unparalleled flexibility. Here, you can create custom reports, freely combining various user metrics with dimensions to uncover specific insights. If a particular metric is incompatible with a chosen dimension or visualization, it will be grayed out, guiding you toward valid analytical combinations.
Strategic Application: Best Practices for User Data
Merely knowing where to find user data is insufficient; the true value lies in applying best practices to ensure accuracy and derive actionable insights.

1. Ensuring Data Accuracy from the Ground Up
A robust tracking setup is the bedrock of reliable analytics. Duplication often arises from installing GA4 tracking tags via multiple methods (e.g., directly in the website code, through a plugin, and via Google Tag Manager simultaneously). While this typically leads to duplicate event counts, it can also distort user metrics by prematurely expiring Client IDs or creating conflicting tracking instances. Regularly audit your GA4 implementation to ensure single, consistent tracking. Establish a clear data governance process for making changes and conducting periodic reviews to maintain data integrity.
2. Proactive Monitoring and Anomaly Detection
Consistent monitoring of user metrics is vital. Unexpected dips or spikes in Total, Active, New, or Returning users can signal critical issues (e.g., broken tracking, website errors, server outages) or significant successes (e.g., viral content, successful marketing campaigns). Leverage GA4’s Custom Insights to set up automated alerts for unusual changes in key user metrics. Enabling email notifications ensures you are promptly informed, allowing for rapid investigation and response.
3. Understanding Aggregation vs. Individual Users
User metrics in GA4 are inherently aggregated; they are calculated in the backend to provide a count of unique individuals over a specified period. Therefore, attempting to sum user counts across different dimensions (e.g., adding up daily unique users to get a weekly total) will lead to inaccuracies. For instance, if a single user visits on Friday and again on Sunday within a 7-day reporting window, they will be counted once for Friday and once for Sunday. Summing these daily figures would yield "2 users," whereas the weekly unique user count for that individual is "1." For true individual user analysis and accurate summation across granular dimensions, exporting data to BigQuery and using the user_pseudo_id is often necessary.
4. Leveraging Segmentation for Deeper Insights
While overall user counts provide a high-level view, segmenting your audience unlocks richer, more actionable intelligence. By segmenting users based on dimensions like traffic source, device type, geographic location, or content consumption patterns, you can answer critical business questions:
- How do users from organic search differ from those from paid campaigns in terms of engagement and conversion rates?
- Are mobile users experiencing issues that desktop users are not?
- Which demographic segments are most valuable, and what content resonates most with them?
Segmentation allows you to tailor strategies, optimize user experiences, and allocate resources more effectively to achieve specific business goals.
5. Differentiating New vs. Returning User Behavior
As previously noted, New and Returning Users are not additive. Analyzing their behaviors separately is crucial for developing targeted strategies:
- High New Users, Low Returning Users: This often indicates strong acquisition efforts but weak retention. Strategies should focus on improving the first-time user experience, onboarding processes, email nurturing campaigns, remarketing ads, and enhancing the overall value proposition to encourage repeat visits.
- Low New Users, High Returning Users: This suggests effective retention and customer loyalty but potentially underperforming acquisition channels. Focus on expanding your reach through SEO, paid advertising, and partnerships to attract new audiences, while continuing to reward and engage your loyal returning users with exclusive content, incentives, or upsell opportunities.
- Monitoring these trends can also signal broader issues, such as content fatigue, declining user experience, or website performance problems. The ultimate goal is to convert new visitors into loyal, returning customers, reducing the continuous need for costly acquisition campaigns.
These best practices are not exhaustive but provide a framework for approaching user data strategically. Beyond merely finding the numbers, it’s about understanding their context and implications, enabling more reliable A/B testing, informed decision-making, and robust strategic planning.

Acknowledging the Nuances: Limitations of GA4 User Data
Despite GA4’s advanced capabilities, its user metrics are not without limitations. Acknowledging these nuances is critical for accurate interpretation and avoiding misinformed conclusions.
1. Client ID’s Device/Browser Dependency
As discussed, the Client ID is tied to a specific browser on a specific device. This means a single individual using two different devices (e.g., phone and laptop) or two different browsers on the same device (e.g., Chrome and Firefox) will be counted as multiple unique users. Without a robust User-ID implementation, truly unique individual counts across a user’s entire digital footprint remain an approximation.
2. The Impact of Browser Privacy Features
Browser privacy measures like Apple’s Intelligent Tracking Prevention (ITP) and similar features in other browsers significantly shorten the lifespan of first-party cookies, including GA4’s _ga cookie. This can lead to an inflated "New User" count, as returning users whose cookies have expired are treated as new visitors. Users who decline cookie consent via Consent Management Platforms (CMPs) will also not be tracked, resulting in an underrepresentation of your true audience.
3. Data Sampling
When querying large datasets or running complex analyses in GA4, especially within Explorations, Google may apply data sampling. This means that instead of analyzing 100% of your data, GA4 uses a representative subset. While sampling provides faster results, it means the numbers presented are estimates rather than precise figures, and confidence intervals should be considered. For unsampled data, especially for large properties, BigQuery integration is often the solution.
4. Data Thresholds
To protect user privacy, GA4 may apply data thresholds to reports, particularly when dealing with small user segments (e.g., demographics or specific audiences). If a segment contains too few users, GA4 might suppress some data to prevent individuals from being identified. This can result in "gaps" in your data or reports that show "0" for certain dimensions, even if some activity occurred. This is a privacy safeguard but can limit granular analysis.
5. Ad Blockers and Network Restrictions
Ad blockers, privacy-focused browser extensions, and corporate network restrictions can prevent GA4 tracking scripts from loading and executing. This directly leads to an undercounting of users and their activities, as their interactions are simply never sent to GA4 servers. The extent of this impact varies by audience and industry but is a universal challenge for client-side analytics tracking.

Awareness of these limitations ensures that insights derived from GA4 user data are contextualized and that any decisions made are based on a realistic understanding of the data’s inherent accuracy and scope.
Summary
This article has aimed to demystify the concept of "unique visitors" within Google Analytics 4, moving beyond the legacy understanding to GA4’s event-centric model. We explored the core definitions of Total Users and Active Users, recognizing their subtle yet significant differences, and detailed how New and Returning Users offer distinct lenses into audience behavior.
We then delved into GA4’s sophisticated user identification mechanisms, from the foundational Client ID stored in the _ga cookie to the hierarchical blending of User-ID, Google Signals, and Device ID. Crucially, we examined the growing impact of browser privacy features and cookie limitations on the accuracy of these metrics.
The guide also provided a comprehensive tour of where to locate user metrics across GA4’s standard reports and the powerful Explorations interface for customized analysis. Finally, we outlined essential best practices for leveraging user data effectively, including ensuring data accuracy, proactive monitoring, understanding data aggregation, employing strategic segmentation, and analyzing new versus returning user behavior. Concurrently, we highlighted critical limitations such as device dependency, privacy impacts, data sampling, thresholds, and ad blockers, emphasizing the need for informed interpretation.
For those eager to deepen their understanding of user engagement, which is central to GA4’s "Active User" definition, a dedicated resource, "GA4 User Engagement Made Visual and Simple," offers further insights.
How do you integrate unique visitor data into your daily analytics workflow in GA4? What specific challenges have you encountered, and how have you addressed them? Share your experiences and insights in the comments below to foster a collaborative learning environment.
