

The Definitive Guide to Engagement Rate: How to Measure and Master Social Performance in 2026
In the fast-paced world of digital marketing, "vanity metrics"—like follower counts—are increasingly taking a backseat to the only number that truly confirms audience resonance: the engagement rate. As social media algorithms prioritize meaningful interaction over passive consumption, understanding how to measure, analyze, and optimize your engagement rate has become a foundational requirement for brands, influencers, and enterprise marketing teams alike.

What is Engagement Rate and Why Does It Matter?
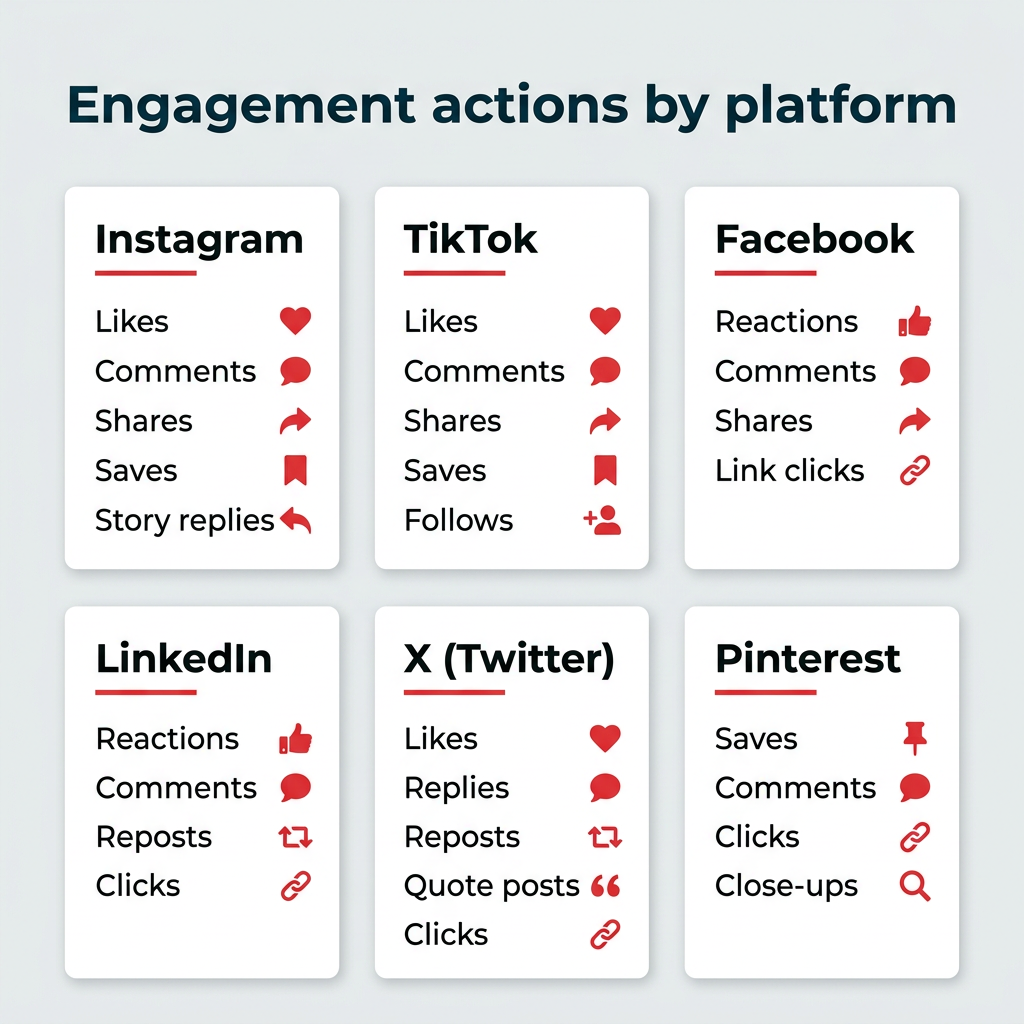
At its core, engagement rate is a social media metric that quantifies how actively your audience interacts with your content. It serves as a benchmark for the effectiveness of your creative strategy by comparing the total volume of interactions (likes, comments, shares, saves, clicks, and messages) against a specific denominator, such as total reach or follower count.

The Strategic Value of Engagement
Why is this metric the primary focus for marketing leaders in 2026?
- Content Validation: High engagement signals that your content is not just being seen, but is being perceived as interesting, valuable, or provocative enough to warrant a physical response.
- Algorithmic Favor: Social media platforms are designed to maximize time-on-platform. When users engage with your content, algorithms recognize the value and "boost" your reach, surfacing your posts to broader, often non-follower audiences.
- Brand Authority: An active comments section and high shareability act as social proof. First-time visitors to your profile view high engagement as a marker of trust and authenticity.
- ROI Justification: For enterprise teams, engagement rate is a tangible bridge between creative output and business impact. It allows marketers to prove to leadership that content is driving measurable audience behavior.
The Six Essential Formulas: Selecting the Right Metric
One size does not fit all. Depending on your business goals—whether you are running a paid advertising campaign or building organic brand awareness—you must select the correct mathematical approach.
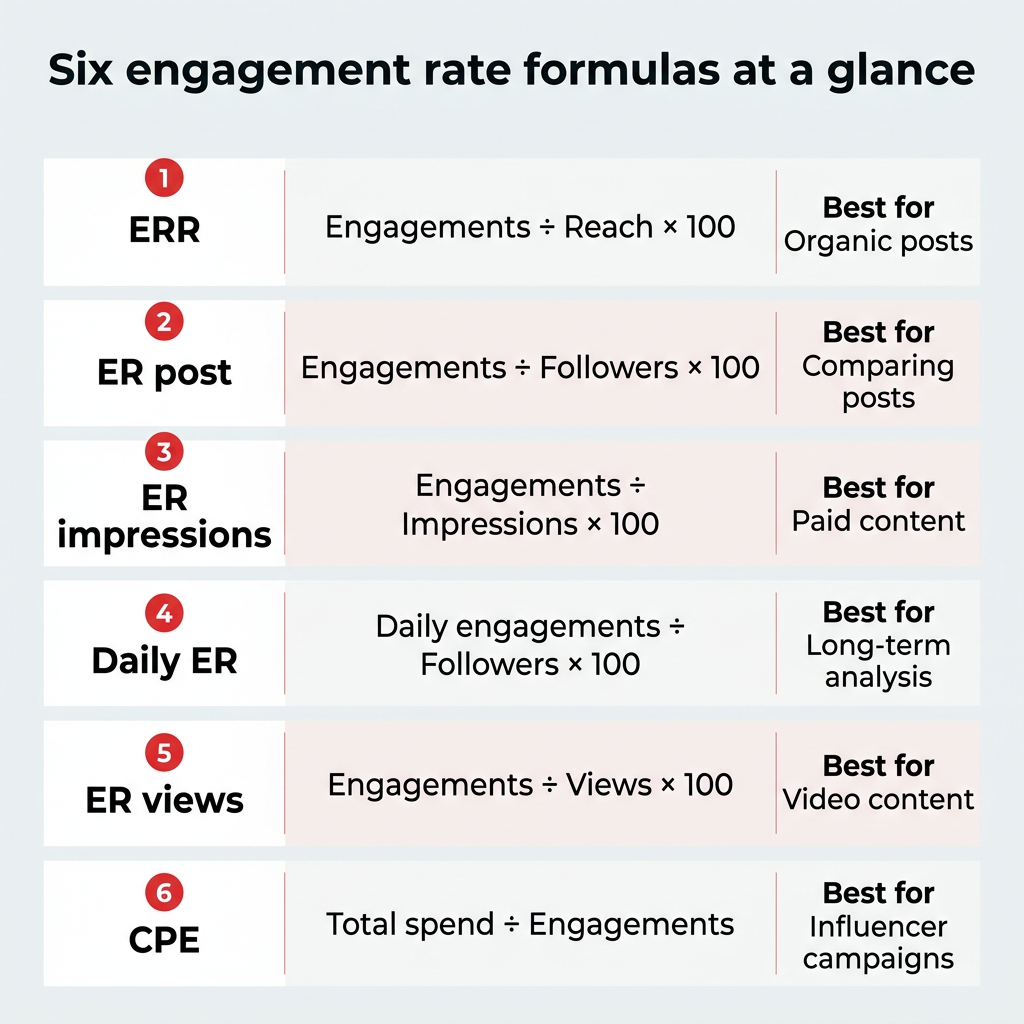
1. Engagement Rate by Reach (ERR)
The Formula: (Total Engagements / Reach) * 100
ERR is widely considered the industry gold standard for organic social media. Because it measures interactions against the actual number of unique accounts that saw the content, it provides an accurate snapshot of how well a post resonates with its audience, regardless of follower count.
2. Engagement Rate by Post (ER Post)
The Formula: (Total Engagements / Total Followers) * 100
This is the most common metric used by influencers. It provides a stable baseline for comparing how individual posts perform relative to your total audience size. However, it can be skewed by viral reach, so it is best used when analyzed alongside follower growth trends.
3. Engagement Rate by Impressions (ER Impressions)
The Formula: (Total Engagements / Total Impressions) * 100
Ideal for paid content and advertising, this formula accounts for the fact that a single user may see a post multiple times. It is particularly useful when evaluating CPM (Cost Per Mille) campaigns.

4. Daily Engagement Rate (Daily ER)
The Formula: (Total Engagements in a Day / Total Followers) * 100
This measures long-term loyalty. It captures interactions on both new posts and older, evergreen content, providing a holistic view of how active your community is on a daily basis.
5. Engagement Rate by Views (ER Views)
The Formula: (Total Engagements / Total Video Views) * 100
As video consumption dominates platforms like TikTok and Instagram Reels, ER Views has become critical. It measures how effectively a video turns viewers into active participants.

6. Cost Per Engagement (CPE)
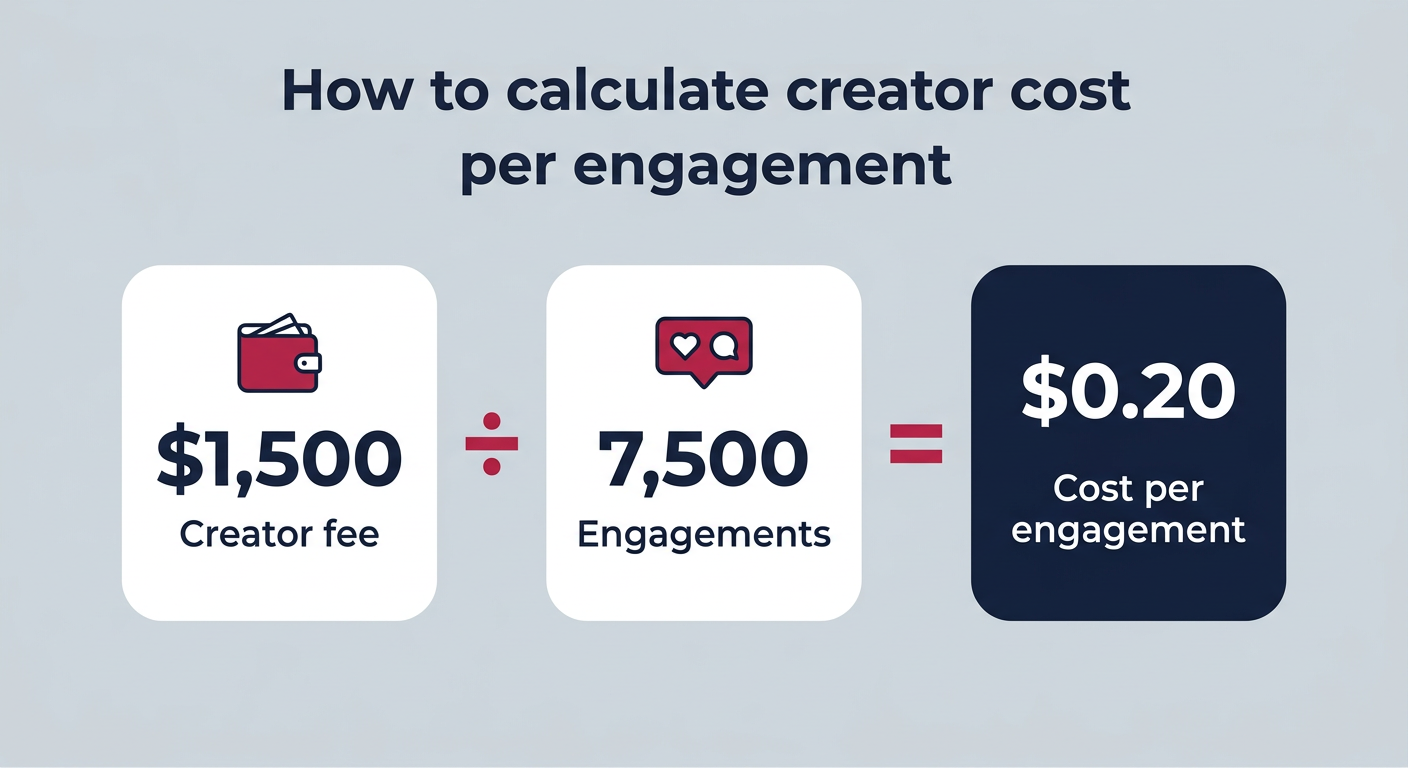
The Formula: (Total Amount Spent / Total Engagements)
Essential for influencer marketing, CPE allows brands to determine the financial efficiency of their partnerships. It places a dollar value on every like, share, and comment, allowing for direct comparison across different creators and platforms.
Benchmarking Success: What is a "Good" Engagement Rate?
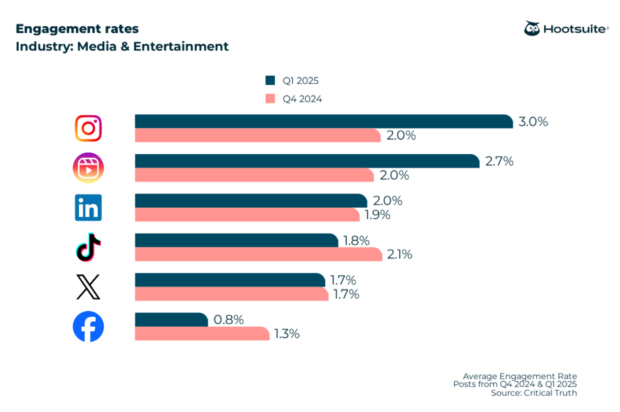
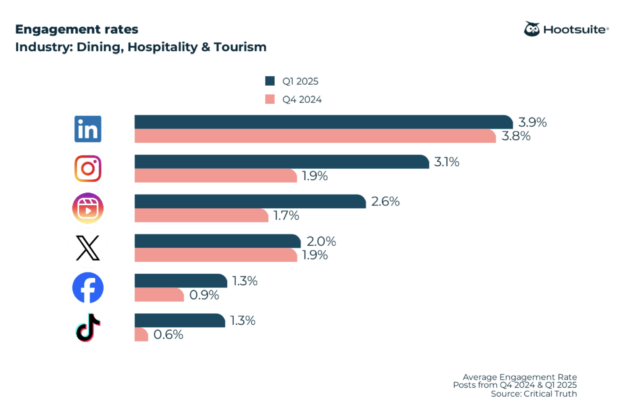
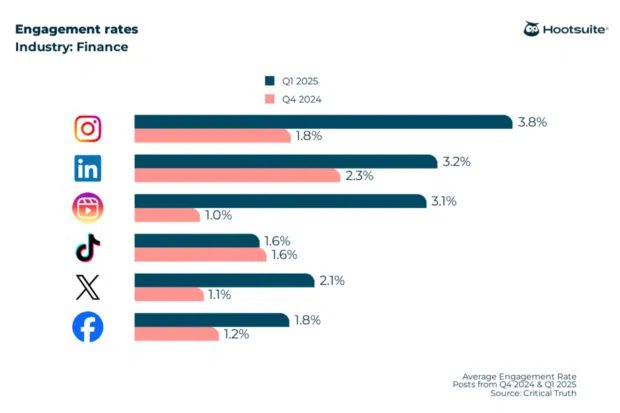
As of 2026, a healthy engagement rate generally falls between 1% and 5%. However, these figures are highly contextual. A 1% rate might be stellar for a highly regulated finance brand, while a 5% rate might be underwhelming for a niche lifestyle brand.
All-Industry Benchmarks (2026)
| Platform | Avg. Engagement Rate (Best Content Type) |
|---|---|
| 4.2% (Carousels) | |
| 3.9% (Videos) | |
| 2.9% (Albums) | |
| X (Twitter) | 1.8% (Status Updates) |
| TikTok | 1.5% (Videos) |
Sector-Specific Insights: Deep Dive
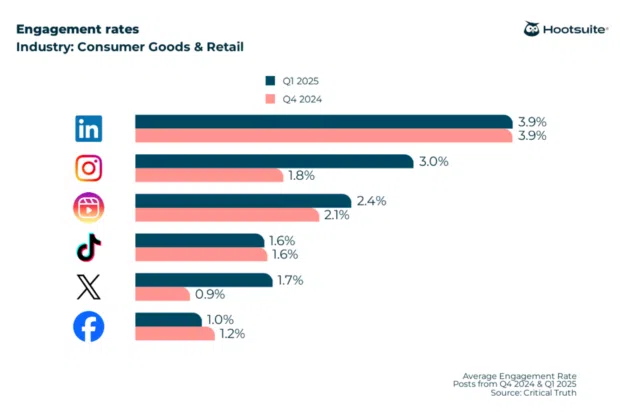
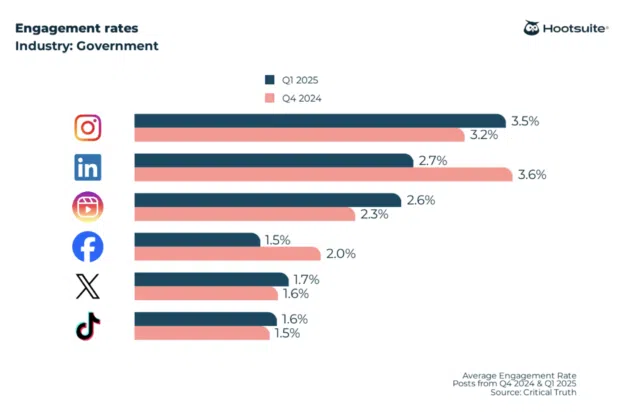
The industry in which you operate dictates your engagement baseline.
- Nonprofits: Often lead the pack, particularly on Instagram (5.5%), as mission-driven content naturally encourages shares and emotional connection.
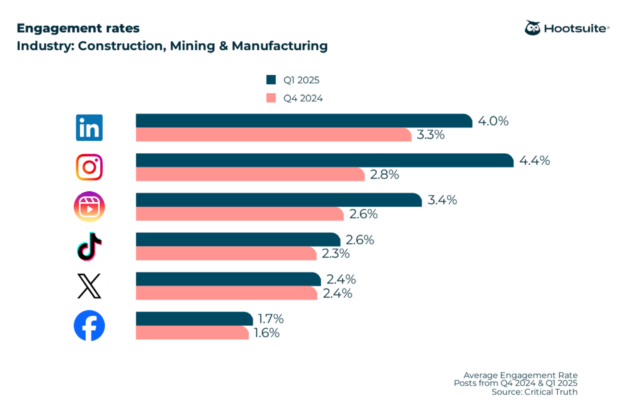
- Construction & Manufacturing: These sectors see surprisingly high engagement on LinkedIn (up to 5.2% on some content), as their audience consists of industry peers and B2B buyers who are highly active on the professional network.
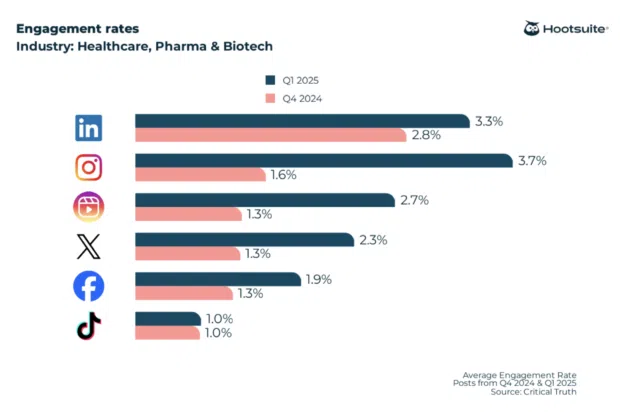
- Healthcare & Pharma: These organizations often face the lowest engagement on platforms like TikTok (approx. 1%), as strict regulatory and privacy compliance limits the use of the casual, trend-based content that typically drives high interaction.
Common Pitfalls: Why Your Data Might Be Lying to You
Before presenting your engagement reports, audit your process for these frequent errors:
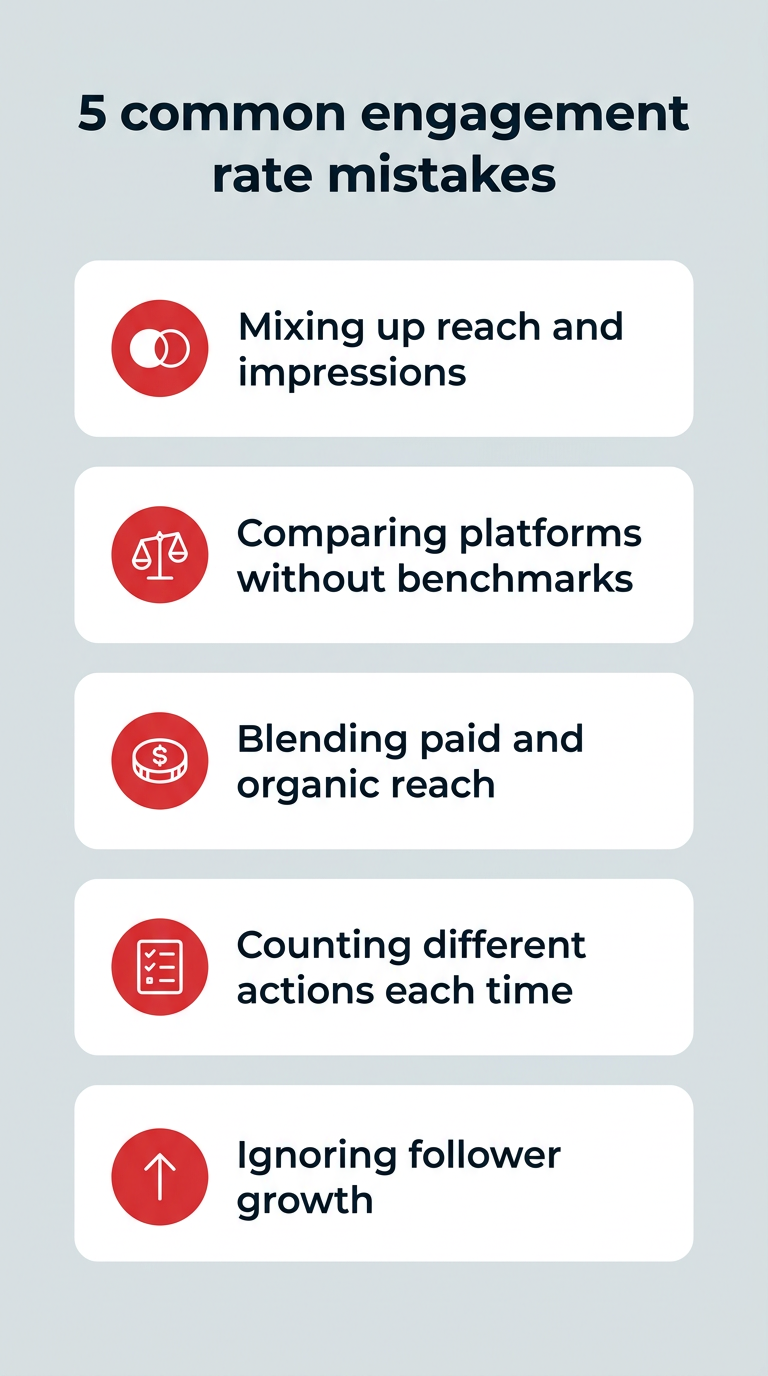
- Mixing Denominators: Comparing a post’s ERR to another post’s ER-by-follower count will lead to incorrect conclusions. Always keep your methodology consistent.
- Including Passive Metrics: Impressions and reach are visibility metrics, not engagement metrics. Never count "views" as "engagements."
- Ignoring Historical Data: A spike in engagement on one post is an outlier. Always analyze patterns over time to understand what truly moves your audience.
- Platform Inconsistency: Remember that TikTok, Instagram, and LinkedIn define "engagement" differently. Ensure your data aggregation accounts for these platform-specific nuances.
Implications for Your Social Strategy
Engagement rate is not just a reporting number; it is a strategic compass. If your data shows that carousels outperform static images on Instagram, your content calendar should pivot to favor that format. If your CPE (Cost Per Engagement) with a specific influencer is significantly lower than your average, that partnership should be expanded.
Future-Proofing Your Reporting
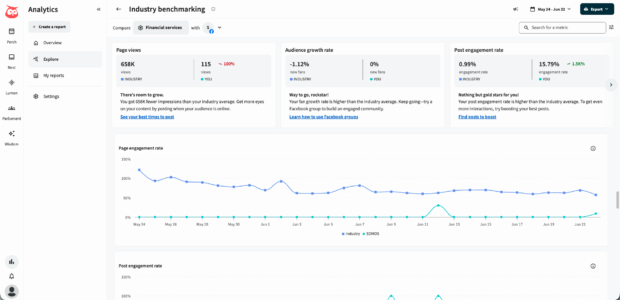
To scale your efforts, leverage analytics tools like Perch by Hootsuite. Automation removes the manual burden of spreadsheet calculations, allowing teams to:
- Centralize Data: View performance across all channels in a single dashboard.
- Automate Reporting: Schedule weekly or monthly snapshots that highlight trends, helping you pivot in real-time.
- Benchmark Performance: Compare your results against industry standards to understand whether your growth is truly competitive.
Final Thoughts
In the current digital landscape, engagement rate is the pulse of your brand. It tells you whether you are speaking into a void or building a community. By mastering the formulas, benchmarking against your specific industry, and leveraging the right analytical tools, you transform social media from a series of disjointed posts into a high-performance marketing engine.
Stop guessing what works. Start measuring, start optimizing, and start winning.
