
The 2026 Social Media Engagement Report: Benchmarks and Strategies for a Shifting Landscape
In the rapidly evolving world of digital marketing, the "engagement rate" remains the North Star for brands looking to gauge the health of their online communities. As we move through 2026, the digital ecosystem has become increasingly saturated, making the battle for user attention more competitive than ever. New data reveals that while follower counts provide a sense of scale, engagement—the actual interaction between a brand and its audience—is the definitive metric for success.

This report synthesizes the latest industry benchmarks across 13 sectors and five major platforms, offering a comprehensive look at what constitutes "success" in the current social media climate.

The Core Definition: What Constitutes Engagement?
At its most fundamental level, the engagement rate is the percentage of an audience that interacts with content rather than passively scrolling past it. While the specific components of an interaction vary by platform—ranging from a "like" on Instagram to a "save" on TikTok or a "repost" on LinkedIn—the math remains consistent: (Total Engagements / Audience Size) x 100.
The most critical takeaway for marketers today is that engagement is a measurement of quality. A boutique account with 1,000 highly invested followers can easily outperform a massive corporate account with 100,000 followers if the latter fails to provoke a response. Engagement is the bridge between mere exposure and genuine brand loyalty.
Why Engagement Rate Dictates Marketing Strategy
For marketing leaders, tracking engagement rates serves four distinct, high-level functions:
- Validating Content Strategy: It identifies which formats (video, carousel, text-only) resonate with your specific demographic.
- Algorithm Optimization: Platforms like Instagram and TikTok prioritize content that generates early interaction. High engagement signals the algorithm to push your content to a wider, non-follower audience.
- Benchmarking ROI: By comparing your engagement against industry averages, you can set realistic KPIs for your social media team.
- Audience Sentiment Analysis: Comments and shares provide a qualitative pulse on how your brand is perceived in real-time.
The Anatomy of Measurement: Three Essential Formulas
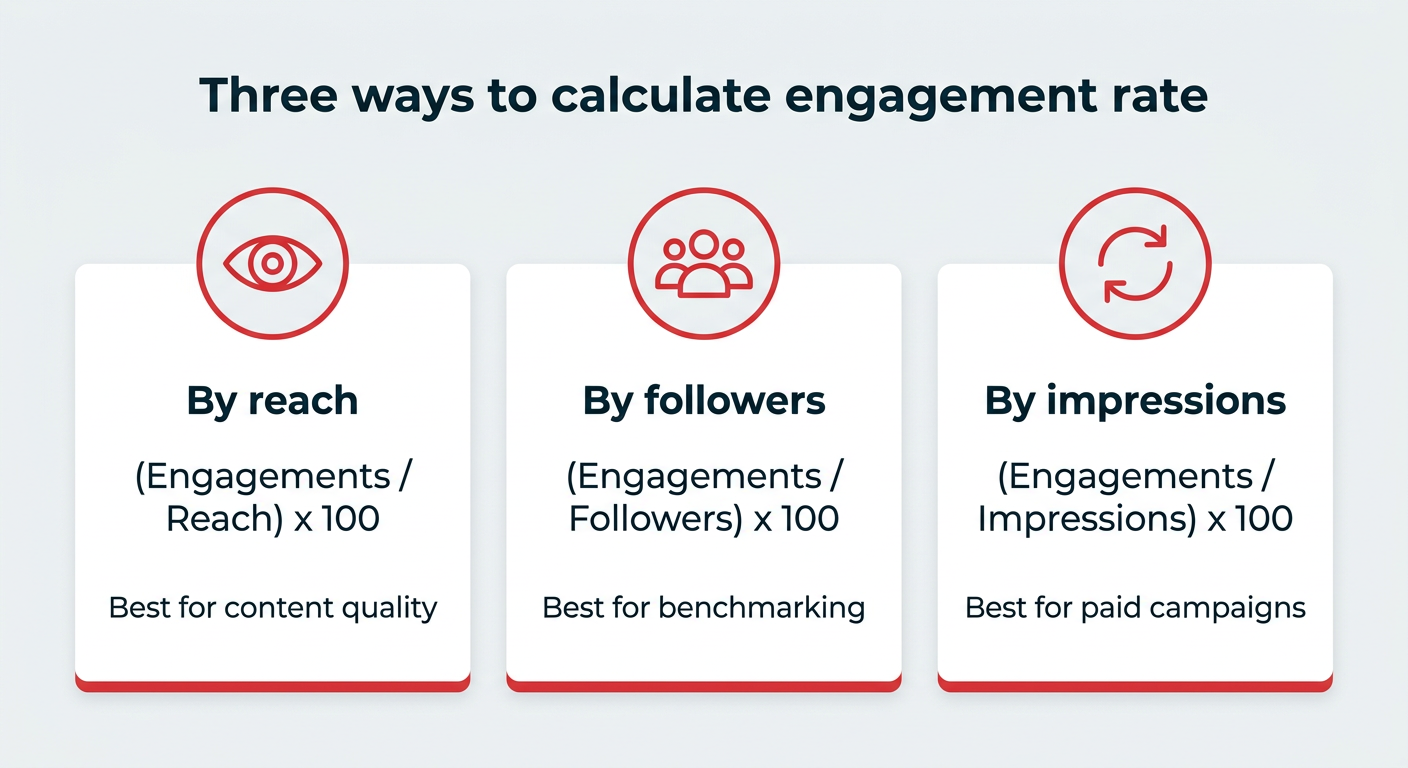
Not all engagement metrics are created equal. Depending on your goals, you should employ one of these three primary calculation methods:
- Engagement by Reach: (Total Engagements / Reach) x 100. This is the most accurate metric for content quality, as it only considers individuals who actually viewed the post.
- Engagement by Followers: (Total Engagements / Followers) x 100. This is the industry standard for reporting and competitive benchmarking.
- Engagement by Impressions: (Total Engagements / Impressions) x 100. Best suited for paid advertising campaigns where frequency and total views are the primary success metrics.
2026 Industry Benchmarks: A Detailed Breakdown
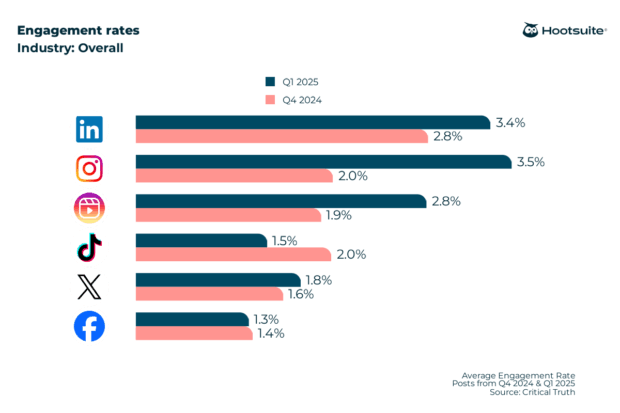
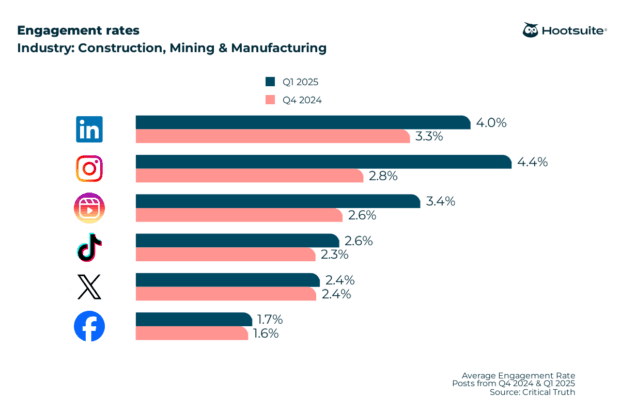
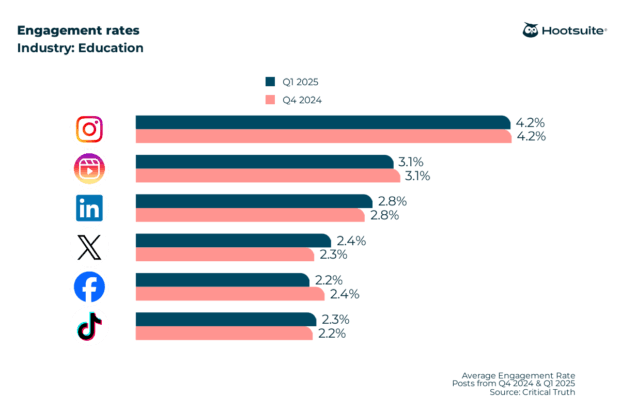
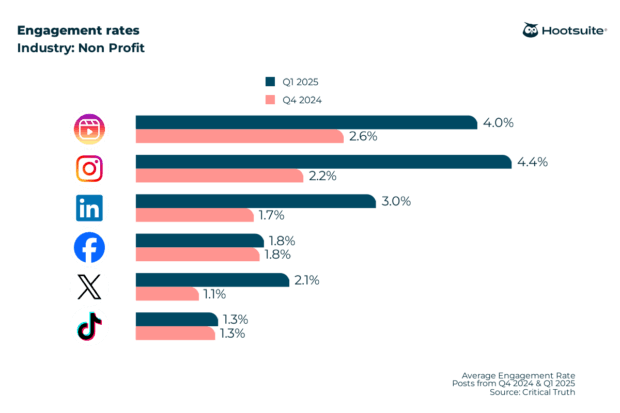
Across all sectors, the performance gap between industries is significant. Our 2026 data shows a clear hierarchy, with construction, education, and nonprofits leading the pack, while media and technology brands often struggle with "engagement fatigue."
The Leaders: Construction, Education, and Nonprofits
- Construction & Manufacturing: By leveraging "behind-the-scenes" footage and high-quality process videos, this sector achieves 5.2% on Instagram and 2.6% on TikTok.
- Education: Benefiting from built-in communities (alumni, students, parents), the education sector sees an impressive 5.4% engagement rate on Instagram and 5.2% on Facebook.
- Nonprofits: Mission-driven storytelling is the key here. Nonprofits hit a high of 5.5% on Instagram, proving that emotional resonance often outweighs production value.
The Middle Ground: Finance, Healthcare, and Professional Services
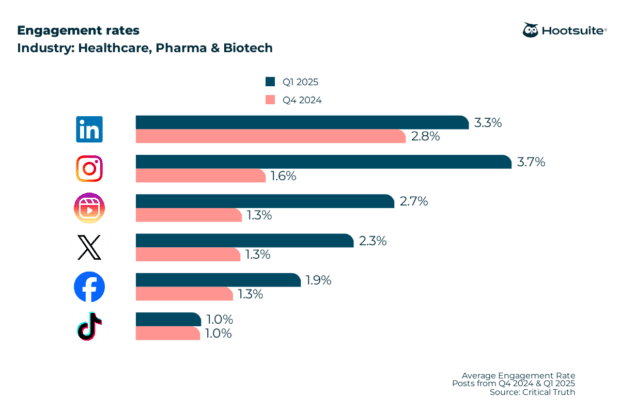
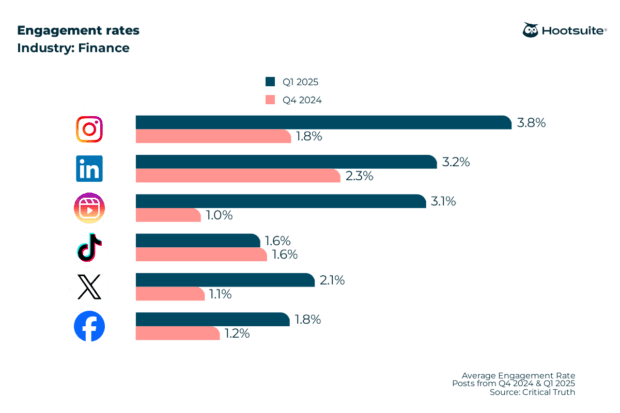
- Financial Services: Unexpectedly strong, this sector earns 4.1% on Instagram and 3.3% on LinkedIn, primarily through educational, "save-worthy" financial advice.
- Healthcare: As trust becomes a premium, healthcare brands are seeing 4.5% engagement on Instagram, though they face challenges on TikTok (1.0%) due to strict regulatory oversight.
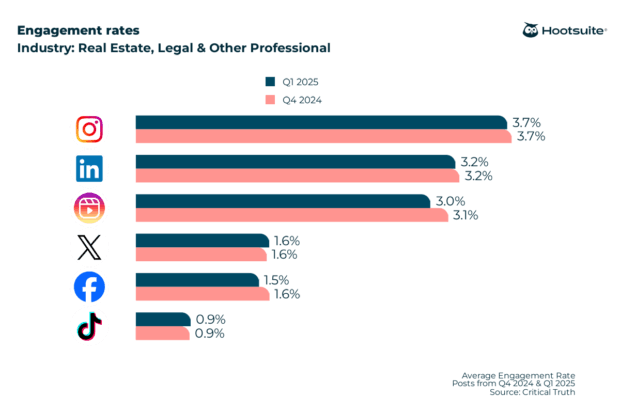
- Professional Services (Real Estate/Legal): These firms perform best on LinkedIn (4.0%), where expertise-led content thrives.
The Underperformers: Media, Technology, and Agencies
- Media & Entertainment: Despite high volume, engagement is often diluted across massive, passive follower bases, leading to lower-than-average rates (e.g., 3.2% on Instagram).
- Technology & Agencies: Both sectors face a steep climb on short-form video platforms like TikTok, often recording below 1% engagement. This suggests that their target audiences prefer long-form, substantive content over the entertainment-first formats that dominate TikTok.
Platform-Specific Realities
When planning for the remainder of 2026, marketers must recognize the unique behavior of each platform:
- Instagram (4.2% average): Still the gold standard for visual storytelling. Its algorithm is highly conducive to discovery, making it the top choice for brand awareness.
- LinkedIn (3.9% average): Growing at an 8% year-over-year rate. It is no longer just for recruiting; it is a B2B powerhouse where substantive, industry-specific content generates high-quality leads.
- Facebook (2.9% average): Increasingly a "pay-to-play" environment. Organic reach is limited, meaning this platform should be treated as a community and paid-ad hub rather than a top-of-funnel discovery tool.
- TikTok (1.5% average): A challenging landscape for brands. Because the recommendation engine prioritizes entertainment for non-followers, traditional brand messaging often falls flat unless it is deeply embedded in cultural trends.
Strategic Implications: How to Improve Your Performance
Improving your engagement rate does not require an infinite budget; it requires a shift in philosophy from "more content" to "better content."
1. The 50/30/20 Rule
Adopt a balanced content mix: 50% of your content should be purely engaging (entertainment/value), 30% should be educational (industry insights), and 20% should be promotional.
2. Prioritize "Save-Worthy" Content
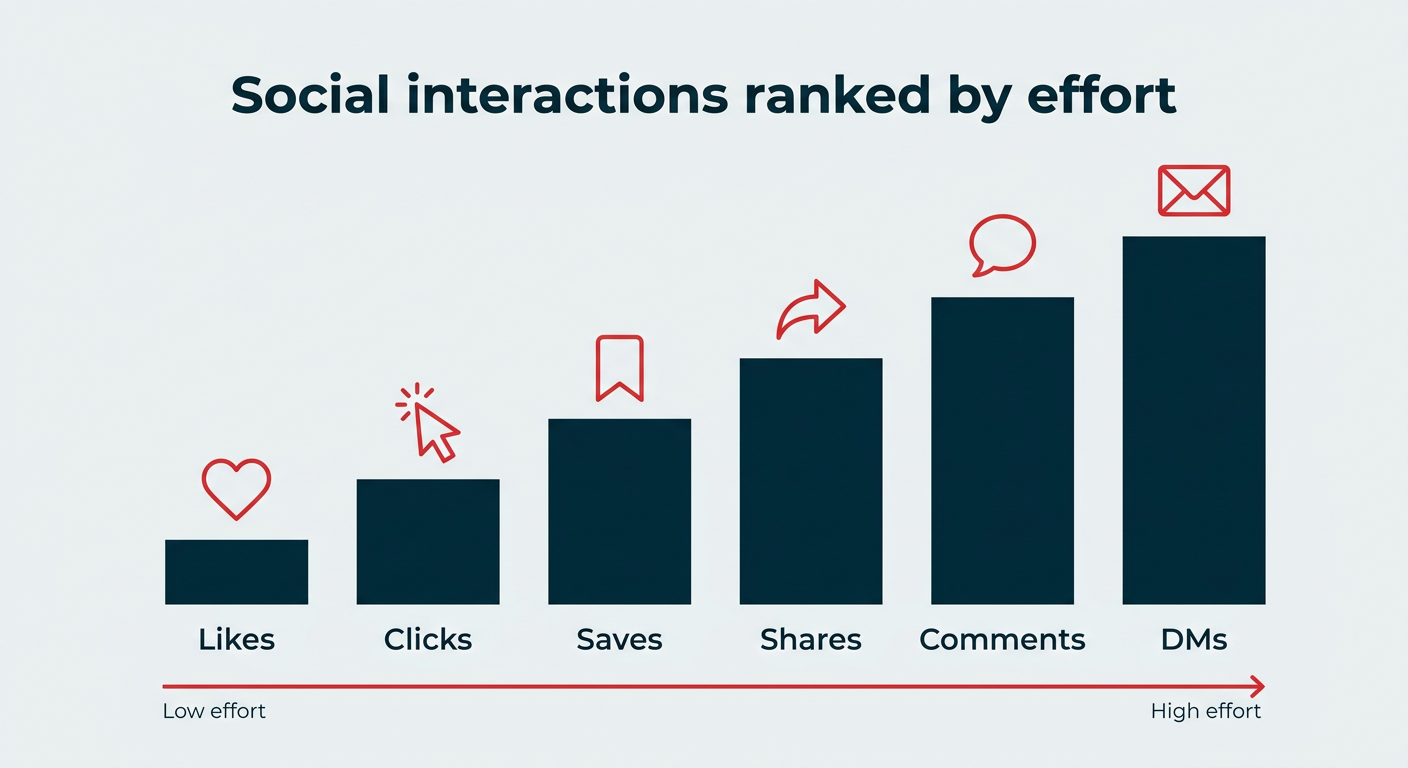
Algorithms are shifting toward rewarding "saves" and "shares" more than simple "likes." Create content that people want to reference later—checklists, tutorials, and deep-dive industry breakdowns.
3. Humanize the Brand
The 2026 trend toward "lo-fi" content is undeniable. High-production, corporate-looking videos are seeing lower engagement than phone-shot, authentic clips that feature real employees or customers.
4. Leverage Your Niche
If you are a smaller account, lean into it. Our data shows that smaller, more specialized accounts often have higher engagement rates than massive, generic ones. Lean into your specific niche to foster a deeper sense of community.
5. Data-Driven Iteration
Stop guessing. Regularly review your engagement data to identify your "top 5" posts of the quarter. Replicate the structure, tone, and visual style of those posts in your upcoming content calendar.
Conclusion
Engagement rate is the ultimate scorecard for modern digital marketing. While it is easy to get distracted by vanity metrics like total follower counts, the true value of a social media presence lies in the depth of connection with your audience. As we look ahead to 2027, the brands that win will be those that stop treating social media as a broadcast channel and start treating it as a conversation. By focusing on high-quality, mission-driven content and adjusting your strategy based on these 2026 benchmarks, your brand can effectively turn passive followers into active advocates.
