

Mastering the Digital Gateway: Essential Landing Page Metrics for Unrivaled Performance
Last Modified: March 19, 2025
In the vast landscape of the internet, a website often functions as a digital storefront. Within this analogy, landing pages are not merely pages but meticulously designed display windows, strategically positioned to capture immediate attention and convert passersby into engaged patrons. Just as a captivating shop window can compel a shopper to enter, a well-optimized landing page holds the power to transform a fleeting visit into a meaningful interaction with a brand. Conversely, a poorly performing landing page can lead to high "bounces" – visitors quickly exiting without engaging – effectively shutting the door on potential opportunities.
The critical nature of landing pages stems from their role as the initial point of contact for many users. Whether driven by costly advertising campaigns, meticulous search engine optimization (SEO) efforts, or organic discovery, this first impression is often the only chance to secure a visitor’s interest. Digital marketers invest substantial resources into directing traffic to these specific pages, making it paramount to understand user behavior and measure performance accurately. Without precise measurement, these investments risk becoming inefficient, failing to yield optimal returns.
This article delves into the top ten indispensable landing page metrics that every marketer and business owner must track. Regardless of the specific analytics platform employed – be it Google Analytics 4 (GA4), Adobe Analytics, or another specialized tool – these core indicators provide the insights necessary to refine strategies, enhance user experience, and maximize the effectiveness of your digital presence.

The Imperative: Why Landing Page Metrics Matter
The digital realm is a competitive arena where every click, every interaction, and every conversion counts. Landing pages are engineered with specific goals in mind: to generate leads, drive sales, encourage sign-ups, or disseminate information. The financial outlay for attracting visitors to these pages, through channels like Paid Search, Social Media Ads, and SEO, can be substantial. Therefore, merely driving traffic is insufficient; understanding what users do once they arrive is the true measure of success.
Tracking key performance indicators (KPIs) allows businesses to move beyond guesswork and embrace data-driven decision-making. These metrics provide a diagnostic toolkit, revealing not only if a landing page is performing but also why it might be succeeding or failing. This understanding enables marketers to:
- Optimize Budget Allocation: Identify which traffic sources or page variations deliver the best return on investment.
- Enhance User Experience (UX): Pinpoint areas of friction, confusion, or disinterest that deter users.
- Refine Content and Design: Understand what resonates with the target audience and what needs improvement.
- Boost Conversion Rates: Implement changes that directly lead to more desired actions.
- Identify Technical Issues: Uncover broken links, slow loading times, or form errors that impede user journeys.
In essence, landing page metrics are the compass guiding optimization efforts, ensuring that every digital interaction moves a user closer to a defined business objective.
The 10 Essential Landing Page Metrics for Data-Driven Optimization
Let’s dive into the metrics that form the bedrock of effective landing page analysis.

1. Traffic Sources: Understanding Where Your Audience Comes From
While not a standalone metric in the traditional sense, analyzing traffic sources is foundational. It provides crucial context for all other metrics, revealing how different channels contribute to your landing page’s performance.
- Definition: Traffic sources categorize how visitors arrive at your landing page (e.g., Organic Search, Paid Search, Social Media, Referral, Direct, Email).
- Why it’s Crucial: Segmenting data by source allows marketers to evaluate the efficacy of their acquisition strategies. A page might perform exceptionally well for organic traffic but poorly for paid social, indicating a misalignment in targeting or messaging.
- Actionable Insights:
- Budget Allocation: If Paid Search is incurring high costs but yielding low conversions compared to Paid Social, insights from this segmentation can inform a strategic shift in budget and effort.
- Campaign Optimization: Discrepancies in performance across sources can highlight issues with ad copy, keyword targeting, audience segmentation, or creative assets that need refinement.
- Content Relevance: Different traffic sources often bring users with varying intents. Understanding this helps tailor content and calls-to-action (CTAs) to better suit the incoming audience.
- In GA4: Traffic source data is readily available in standard reports and can be used as a dimension in Explorations to slice and dice other metrics.
2. Conversion Rate: The Ultimate Measure of Success
The conversion rate is arguably the most critical metric for any landing page, directly quantifying its effectiveness in achieving its primary goal.
- Definition: Conversion Rate (CR) measures the percentage of visitors who complete a desired action (a "conversion") on your landing page. This action could be submitting a form, making a purchase, downloading an asset, or signing up for a newsletter.
- Formula:
(Total Conversions / Total Visitors) * 100 - Why it’s Crucial: A high conversion rate signifies that your landing page effectively persuades visitors to take the intended action. It’s a direct indicator of your page’s relevance, clarity, and persuasive power.
- Actionable Insights:
- Page Effectiveness: Identify which landing pages convert better than others and analyze their common attributes (design, copy, CTAs).
- A/B Testing: Conversion rate is the primary metric for evaluating A/B tests on headlines, images, copy, and CTA button variations.
- Segmentation: Analyzing CR by traffic source, device type, new vs. returning visitors, or demographic segments can reveal specific optimization opportunities.
- Benchmarking: While industry averages (e.g., 2-5% for e-commerce, higher for lead generation) offer a general guide, your optimal CR will depend on your specific industry, product value, and business model. Continual improvement against your own historical data is key.
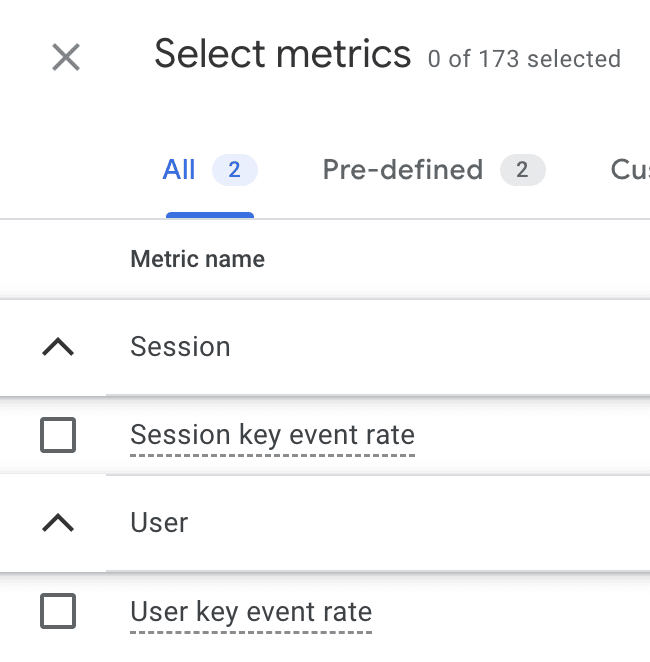
- In GA4: GA4 tracks "Key Events" (its term for conversions). You can find "Session conversion rate" and "User conversion rate" in various reports and Explorations.
3. Bounce Rate: Gauging Immediate Engagement
Bounce rate offers a quick snapshot of how well your landing page captures initial interest.
- Definition: Bounce rate is the percentage of single-page sessions on your landing page. A session is considered a "bounce" if the user views only one page and takes no further action (like clicking an internal link, filling a form, or scrolling significantly) before exiting.
- Formula:
(Sessions with one page view / Total Sessions) * 100 - Why it’s Crucial: A high bounce rate often indicates that visitors found the page irrelevant, confusing, or unappealing, leading them to leave immediately.
- Actionable Insights:
- Content-Ad Discrepancy: High bounce rates from paid campaigns might signal a mismatch between ad messaging and landing page content.
- User Experience Issues: Slow loading times, poor mobile responsiveness, confusing navigation, or overwhelming design can contribute to bounces.
- Contextual Nuance: It’s important to interpret bounce rate in context. A high bounce rate for a blog post (where users might quickly find an answer and leave) is different from a high bounce rate on a product page meant for conversion. Hubspot suggests an industry average between 26% and 70%, but this varies widely. For content-heavy pages, 65% or more can be typical.
- Technical Glitches: An unusually high (near 100%) or low (near 0%) bounce rate with significant traffic might indicate tracking implementation errors.
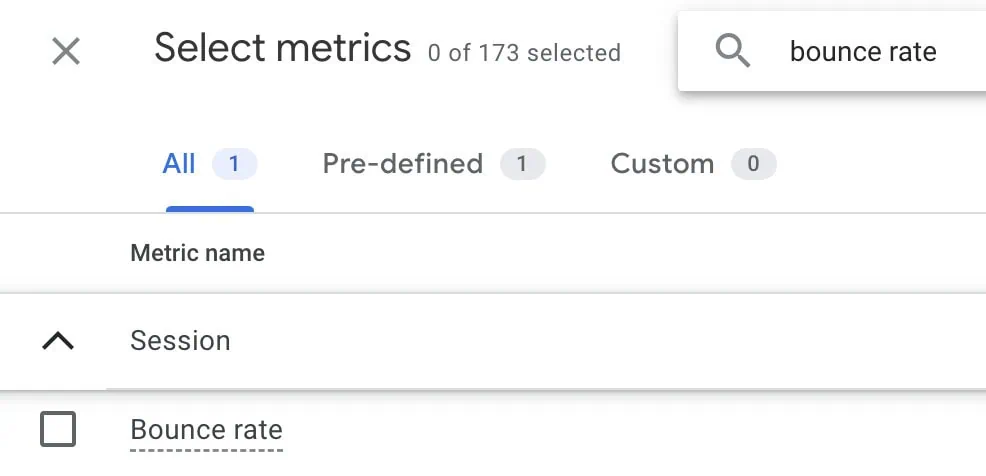
- In GA4: While Universal Analytics had a direct "Bounce Rate" metric, GA4 uses "Engagement Rate" (the inverse of bounce rate in some contexts) and you can find "Bounce Rate" in Explorations or custom reports.
4. Average Time on Page (or Average Engagement Time in GA4): Measuring Dwell Time
This metric helps understand how long visitors actively spend on your landing page, offering insights into content consumption and engagement depth.
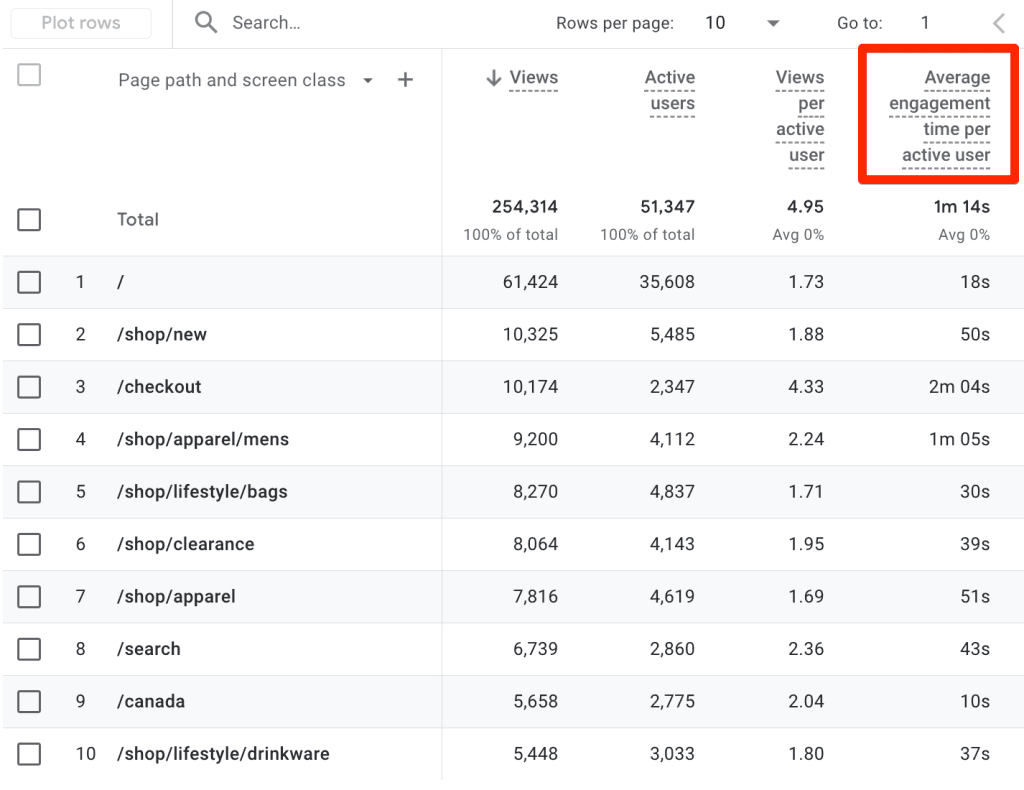
- Definition: Average Time on Page (or Average Engagement Time in GA4) measures the average duration a user spends actively viewing a specific landing page. GA4’s "Engagement Time" is generally more accurate as it filters out idle time.
- Why it’s Crucial: Longer times often suggest greater interest and deeper engagement with your content. However, context is key.
- Actionable Insights:
- Content Value: For informational or complex product pages, a short average time might indicate that content isn’t compelling or easy to digest.
- Information Overload/Lack: If a simple form-fill page has a very high average time, users might be struggling to find information or complete the form. Conversely, if a detailed whitepaper download page has a low average time, users might not be perceiving its value or are put off by its length.
- CTAs and Usability: If users are spending a lot of time but not converting, it could indicate confusing CTAs, broken elements, or a lack of clear next steps.
- In GA4: The "Average Engagement Time" is available in the "Pages and screens" report and Explorations, offering a more robust measure than traditional "time on page."
5. Form Abandonment Rate: Uncovering Friction in the Conversion Funnel
For landing pages designed to capture leads or gather information, form abandonment rate is a vital diagnostic tool.
- Definition: Form Abandonment Rate measures the percentage of users who start filling out a form but do not complete it.
- Formula:
((Users who started form - Users who completed form) / Users who started form) * 100- Example: If 600 users started a form and 240 completed it, the abandonment rate is
((600 - 240) / 600) * 100 = 60%.
- Example: If 600 users started a form and 240 completed it, the abandonment rate is
- Why it’s Crucial: High abandonment rates signal friction points within the form itself, preventing potential conversions.
- Actionable Insights:
- Form Length and Complexity: Too many fields, intrusive questions, or unclear instructions can deter users.
- Technical Issues: Form validation errors, unresponsive fields, or submission failures will lead to abandonment.
- Trust and Privacy: Concerns about data privacy or the perceived value exchange for providing information can also increase abandonment.
- Optimization Strategies: Implement progress bars for multi-step forms, clear error messages, pre-fill known information, or reduce the number of required fields. A/B test different form layouts and field types.
- In GA4: This metric often requires custom event tracking for "form_start" and "form_submit" events, allowing you to build custom metrics or funnels in Explorations.
6. Cost Per Conversion (CPC): Evaluating Paid Marketing Efficiency
When traffic to landing pages is driven by paid campaigns, Cost Per Conversion (also known as Cost Per Acquisition, CPA) is indispensable for financial accountability.
- Definition: Cost Per Conversion measures the average cost incurred to achieve a single conversion.
- Formula:
Marketing Cost ($) / Total Conversions- Example: If a campaign costs $2,500 and yields 121 conversions, the CPC is
$2,500 / 121 = $20.67.
- Example: If a campaign costs $2,500 and yields 121 conversions, the CPC is
- Why it’s Crucial: This metric directly links marketing expenditure to tangible results, determining the profitability and efficiency of your campaigns.
- Actionable Insights:
- ROI Analysis: Compare CPC against the lifetime value (LTV) or average order value (AOV) of a conversion to ensure campaigns are profitable.
- Budget Optimization: Identify which campaigns, ad groups, or keywords are driving conversions at the most efficient cost.
- Bidding Strategy Adjustment: High CPC might necessitate adjusting bids, refining targeting, or improving ad quality scores to lower costs.
- Landing Page Impact: A high CPC for a particular landing page indicates that while traffic might be coming in, the page itself isn’t converting efficiently enough to justify the ad spend. This highlights a need for landing page optimization.
- In GA4: Integrate your advertising platforms (e.g., Google Ads) with GA4 to pull cost data and calculate CPC within the analytics interface or through connected tools like Looker Studio.
7. Exit Rate: Pinpointing Drop-Off Points
While often confused with bounce rate, exit rate serves a distinct purpose, especially in multi-page user journeys.
- Definition: Exit Rate is the percentage of page views for a specific page that were the last in a session. It focuses on sessions that end on that page, regardless of how many pages the user viewed prior.
- Formula:
(Number of Exits from Page / Total Pageviews for Page) * 100 - Why it’s Crucial: Exit rate helps identify pages where users frequently abandon their journey after having engaged with other parts of your site. It’s particularly useful for analyzing multi-step funnels.
- Actionable Insights:
- Funnel Analysis: If a landing page is meant to guide users further into a conversion funnel (e.g., product page to cart to checkout), a high exit rate suggests a significant drop-off point.
- Content/Design Flaws: Users might be exiting because they found what they needed (and thus completed their goal), or because the content was insufficient, confusing, or led to a dead end.
- Technical Problems: Broken links, slow loading times for subsequent pages, or confusing navigation can cause users to exit prematurely.
- Optimizing Next Steps: Analyze pages with high exit rates to improve internal linking, clarify CTAs for the next step, or enhance the perceived value of continuing the journey.
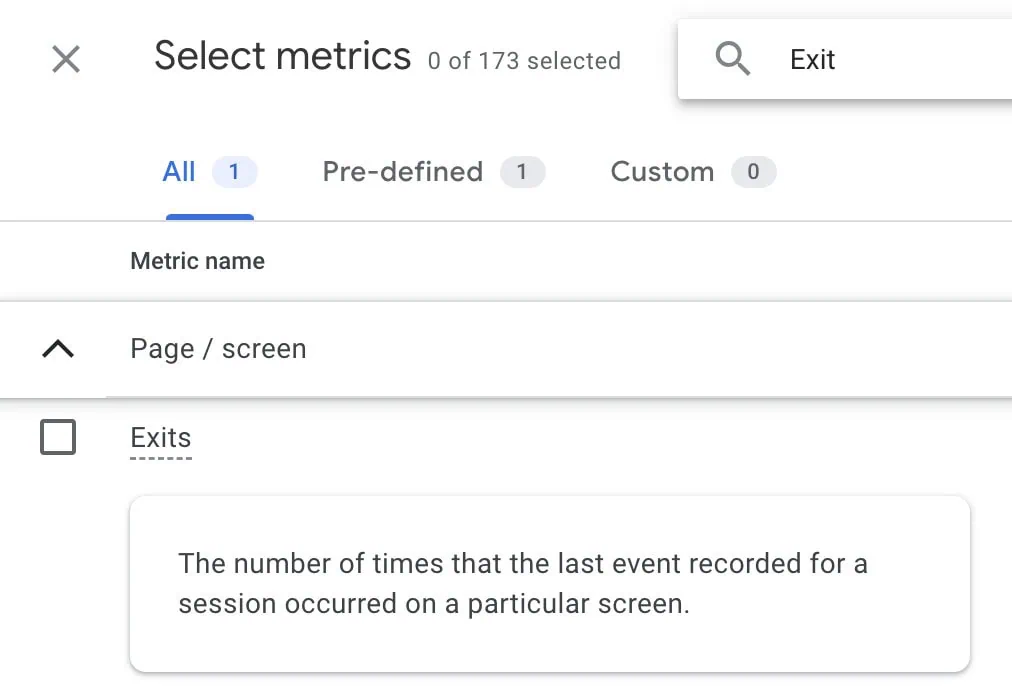
- In GA4: The "Exits" metric is available in Explorations. To calculate the rate, you might need to export data to a spreadsheet or Looker Studio.
8. Scroll Depth: Understanding Content Consumption
Scroll depth reveals how much of your landing page content visitors are actually viewing, informing content placement and design.
- Definition: Scroll depth measures how far down a page a user scrolls, typically expressed as a percentage (e.g., 25%, 50%, 75%, 100%). It primarily refers to vertical scrolling but can also apply to horizontal elements like comparison tables.
- Why it’s Crucial: This engagement metric helps determine if important information, CTAs, testimonials, or legal disclaimers placed lower on the page are actually being seen.
- Actionable Insights:
- CTA Placement: If key CTAs are at 75% scroll depth but most users only scroll to 50%, you might need to move them higher "above the fold" or reiterate them.
- Content Effectiveness: For long-form content, low scroll depth might indicate that the content isn’t engaging enough or is poorly structured, prompting users to leave before consuming the full message.
- Information Hierarchy: Use scroll depth to validate your content hierarchy. Ensure the most critical information is presented early to maximize visibility.
- Heatmaps Integration: Combine scroll depth data with heatmaps (from tools like Hotjar or Microsoft Clarity) to visually understand where users stop scrolling and what elements they interact with at different depths.
- In GA4: Scroll depth is available as a dimension ("percent scrolled") in Explorations, allowing you to segment other metrics by how far users scrolled.
9. Click-Through Rate (CTR): Measuring Call-to-Action Effectiveness
CTR assesses the effectiveness of your interactive elements, guiding users to their next destination.
- Definition: Click-Through Rate (CTR) measures the percentage of visitors who click on a specific interactive element (e.g., a button, link, image) on your landing page, relative to the number of times that element was displayed.
- Formula:
(Total Clicks on Element / Total Impressions of Element) * 100- Example: If a CTA button was visible 2,340 times and received 147 clicks, the CTR is
(147 / 2,340) * 100 = 6.28%.
- Example: If a CTA button was visible 2,340 times and received 147 clicks, the CTR is
- Why it’s Crucial: A high CTR indicates that your copy, design, and calls-to-action are compelling and relevant, successfully encouraging users to take the next step.
- Actionable Insights:
- CTA Optimization: A low CTR signals issues with the CTA itself – perhaps the wording isn’t strong, the design isn’t prominent, or its placement is suboptimal. A/B test different CTA copy, colors, sizes, and positions.
- Perceived Value: Users might not be clicking because they don’t perceive enough value in the destination or the offer.
- Technical Validation: A sudden dip in CTR could indicate a broken link or a non-functional button, requiring immediate investigation.
- Internal Navigation: For landing pages that serve as gateways to other parts of your site, CTR on internal links indicates how well the page guides users through their journey.
- In GA4: You can track clicks on specific elements by setting up custom event tracking for those interactions.
10. New vs. Returning Visitors: Tailoring the User Journey
Segmenting visitors into new and returning categories provides insights into distinct user behaviors and allows for targeted strategies.
- Definition: This categorizes users into those visiting your site for the first time ("New Visitors") and those who have visited before ("Returning Visitors").
- Why it’s Crucial: These two groups often have different intents, levels of familiarity with your brand, and conversion pathways. Understanding their distinct behaviors is vital for personalization and optimization.
- Actionable Insights:
- Acquisition vs. Retention: New visitors are crucial for growth (acquisition), while returning visitors represent loyalty and often have higher conversion potential (retention).
- Behavioral Discrepancies: Analyze other metrics (conversion rate, bounce rate, time on page) for each segment. For instance, a high bounce rate for new visitors might indicate initial messaging isn’t clear, while a low conversion rate for returning visitors could suggest they’re looking for new information or have encountered a barrier.
- Personalization Opportunities: Tailor content, offers, and CTAs based on whether a user is new or returning. Returning visitors might respond better to loyalty programs or advanced product features, while new visitors need clearer introductions.
- Funnel Optimization: Understand where each segment drops off in the conversion funnel. Are new visitors leaving at the first step, or are returning visitors getting stuck before checkout?
- In GA4: Both "New users" and "Returning users" metrics are available in standard reports and Explorations, allowing for easy segmentation and comparative analysis.
Beyond the Numbers: A Holistic Approach to Optimization
While these ten metrics provide a robust quantitative framework, true optimization goes beyond mere numbers. The "whats" revealed by these metrics must be complemented by the "whys" uncovered through qualitative analysis.
Integrating these quantitative insights with behavioral web analytics tools like Hotjar or Microsoft Clarity can offer profound understanding. Heatmaps visually represent user attention and click patterns, while scroll maps confirm where users stop engaging. Session recordings allow marketers to literally watch user journeys, identifying moments of hesitation, confusion, or technical friction.
Furthermore, direct user feedback through exit-intent surveys, on-page polls, and user testing sessions can provide invaluable qualitative data. Asking users why they are leaving, what they found confusing, or what information they couldn’t locate can directly inform design and content changes that significantly improve user experience and, consequently, conversion rates.
Ultimately, the choice of which metrics to prioritize and how to interpret them hinges on the specific goals of each landing page and the broader business objectives. A continuous cycle of measurement, analysis, hypothesis generation, A/B testing, and implementation is the hallmark of a successful digital marketing strategy.
Conclusion
Landing pages are pivotal assets in any digital marketing strategy, serving as dedicated gateways for user engagement and conversion. By diligently tracking and analyzing the ten essential metrics discussed – from understanding traffic origins to evaluating click-through effectiveness and differentiating between new and returning visitors – businesses can transform raw data into actionable insights.
These metrics offer a clear roadmap for identifying areas of strength and weakness, enabling marketers to optimize content, refine design, and streamline user journeys. However, their power is amplified when viewed through the lens of business goals and supplemented by qualitative research. The most effective optimization strategies arise from a synergistic blend of quantitative data and a deep understanding of user behavior.
In an ever-evolving digital landscape, continuous monitoring and iterative improvement are not merely best practices but necessities. By embracing a data-driven approach, businesses can ensure their landing pages are not just digital shop windows, but highly efficient conversion engines, driving sustainable growth and maximizing return on investment.
What metrics do you prioritize for your landing pages, and how have they shaped your optimization efforts? Share your insights in the comments below.
