

The Modern Social Media Dashboard: Transforming Raw Data into Strategic Advantage
In an era where social media ad spending is projected to surpass $121 billion in the United States by 2026, the cost of flying blind has never been higher. For modern enterprises and marketing agencies, the challenge is no longer a lack of data; it is an overwhelming surplus of it. Disconnected metrics—scattered across Instagram, LinkedIn, TikTok, and X—create a fragmented view of brand performance.

A social media dashboard is the antidote to this fragmentation. By consolidating metrics into a single, intuitive interface, these tools allow teams to track, analyze, and report on performance with precision. In this article, we explore how these digital command centers are evolving to bridge the gap between creative execution and boardroom-level ROI.

The Core Functions of a Social Media Dashboard
At its most fundamental level, a social media dashboard is a centralized interface that pulls data from multiple social channels into a unified view. It serves as the bridge between raw platform statistics and actionable business intelligence.
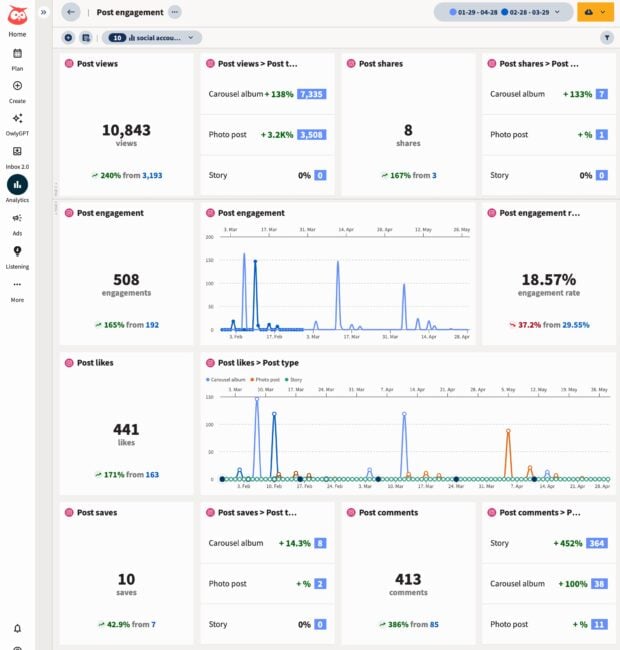
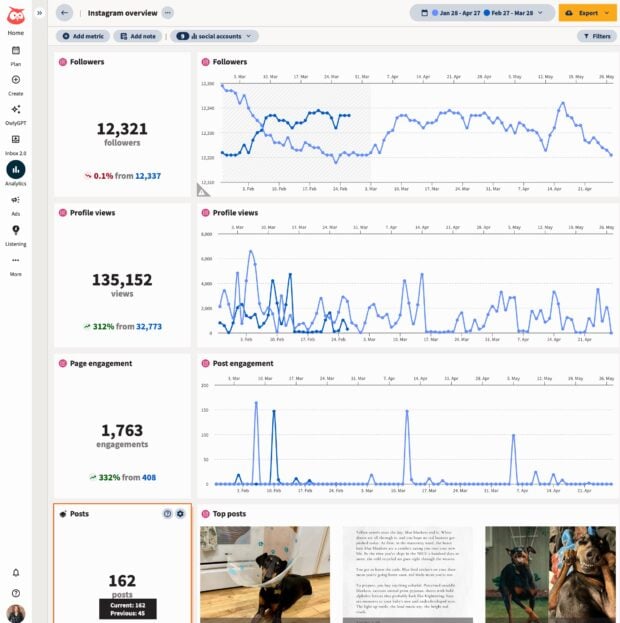
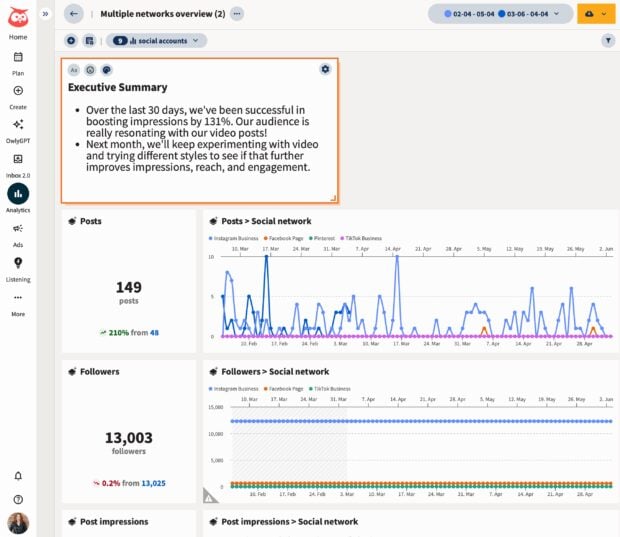
For enterprise teams, the reporting burden scales linearly with every new account and campaign. Without a dashboard, a social media manager might spend hours manually logging into individual platforms, downloading spreadsheets, and reformatting data into a coherent presentation. A dashboard automates this, providing real-time visualizations—charts, graphs, and heatmaps—that highlight exactly what is working and where budgets are being squandered.
The Four Pillars of Dashboard Utility
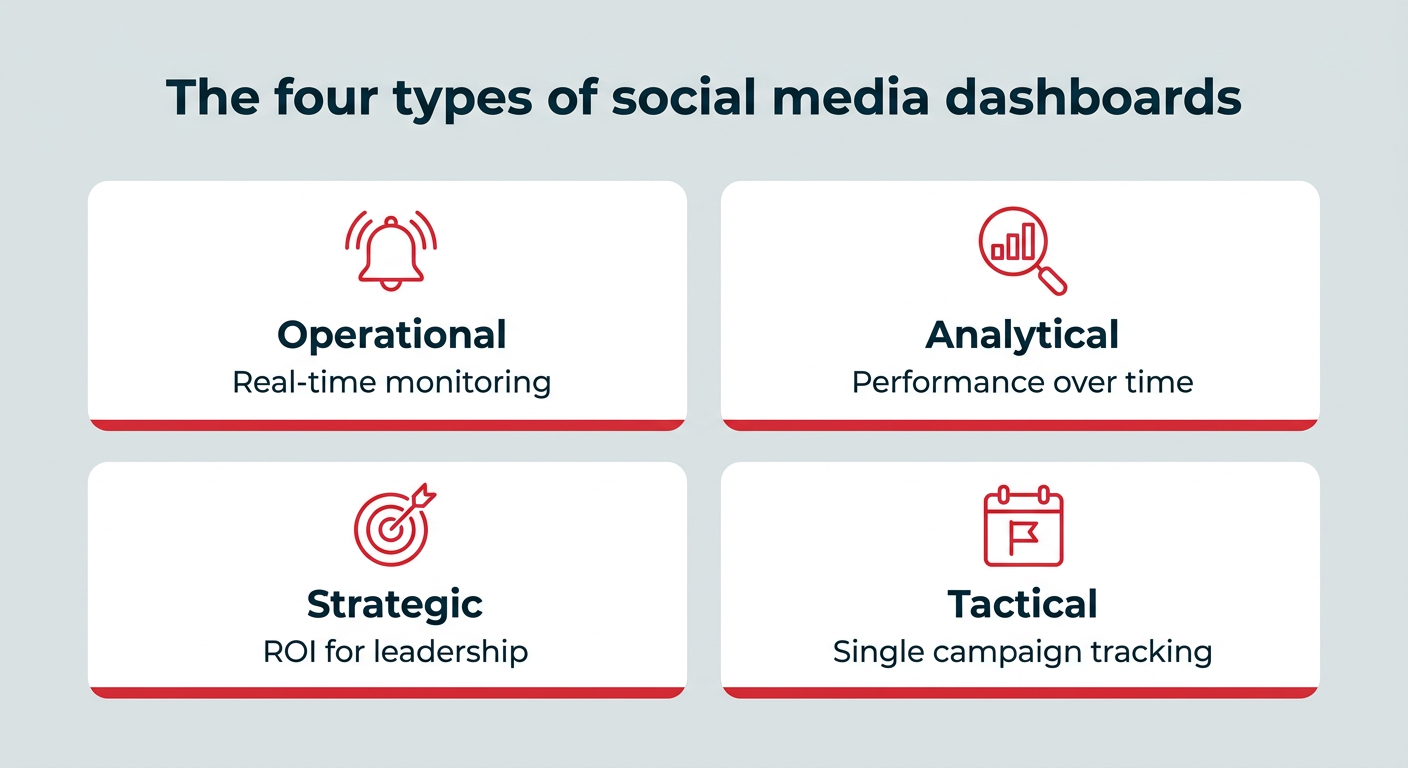
To avoid the common pitfall of "dashboard clutter," professionals categorize their reporting into four distinct types:

- Operational Dashboards: Designed for community and care teams, these track real-time activity, such as incoming mentions, response times, and sentiment spikes.
- Analytical Dashboards: The domain of social media managers, these focus on long-term trends in content performance and audience growth.
- Strategic Dashboards: Built for CMOs and VPs, these prioritize high-level KPIs, ROI, and progress toward long-term business goals.
- Tactical Dashboards: Used by campaign managers to monitor the specific lifecycle of a paid social initiative from launch to conclusion.
Supporting Data: Why Measurement is the New Currency of Marketing
The necessity of robust dashboards is underscored by the current economic climate. With 59% of CMOs reporting that their budgets have flatlined at approximately 7.8% of total revenue, there is little room for experimental inefficiency.
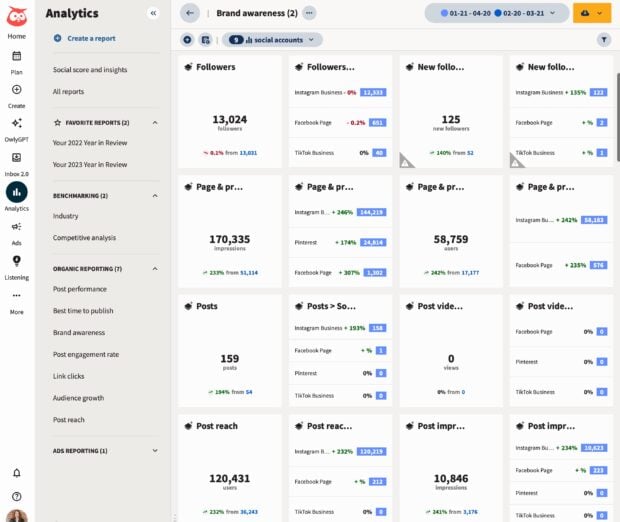
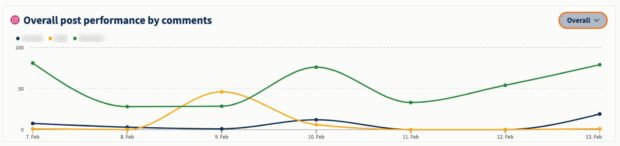
Modern dashboards provide the context needed to justify marketing spend. By layering historical data over current performance, these tools allow teams to identify trend lines rather than just isolated numbers. This is critical for proving value to leadership. When a CMO asks, "Is our social strategy driving revenue?" a dashboard that integrates with a CRM or Google Analytics can show the direct path from a social link click to a conversion event.
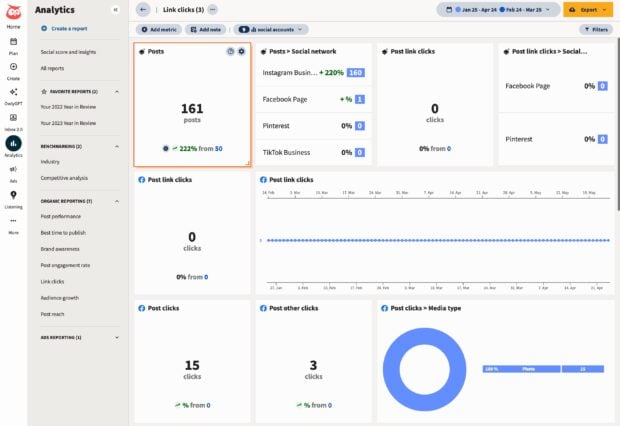
Furthermore, the integration of AI-powered insights is changing the landscape. Systems like Hootsuite Social OS now offer automated summaries that can detect anomalies—such as a sudden drop in engagement or an unexpected viral post—alerting teams before a negative trend becomes a brand crisis.
Chronology of Dashboard Evolution
The journey of social media reporting has evolved through three distinct stages:
- The Manual Era (Pre-2015): Teams relied on "native reporting," manually copying and pasting stats from each platform into Excel. Data was siloed, and "cross-platform" analysis was virtually impossible.
- The Integration Era (2015–2022): The rise of third-party APIs allowed tools to pull data into single panes of glass. This was the birth of the modern "social suite," allowing for scheduling and analytics to coexist.
- The Intelligent Era (2023–Present): We have entered the age of AI-driven dashboards. Today’s platforms do more than just display numbers; they interpret them. Through predictive modeling and natural language processing, dashboards now provide recommendations, such as "Your audience is most active on Tuesday mornings; reschedule your next post to match this window."
Strategic Applications: Beyond Vanity Metrics
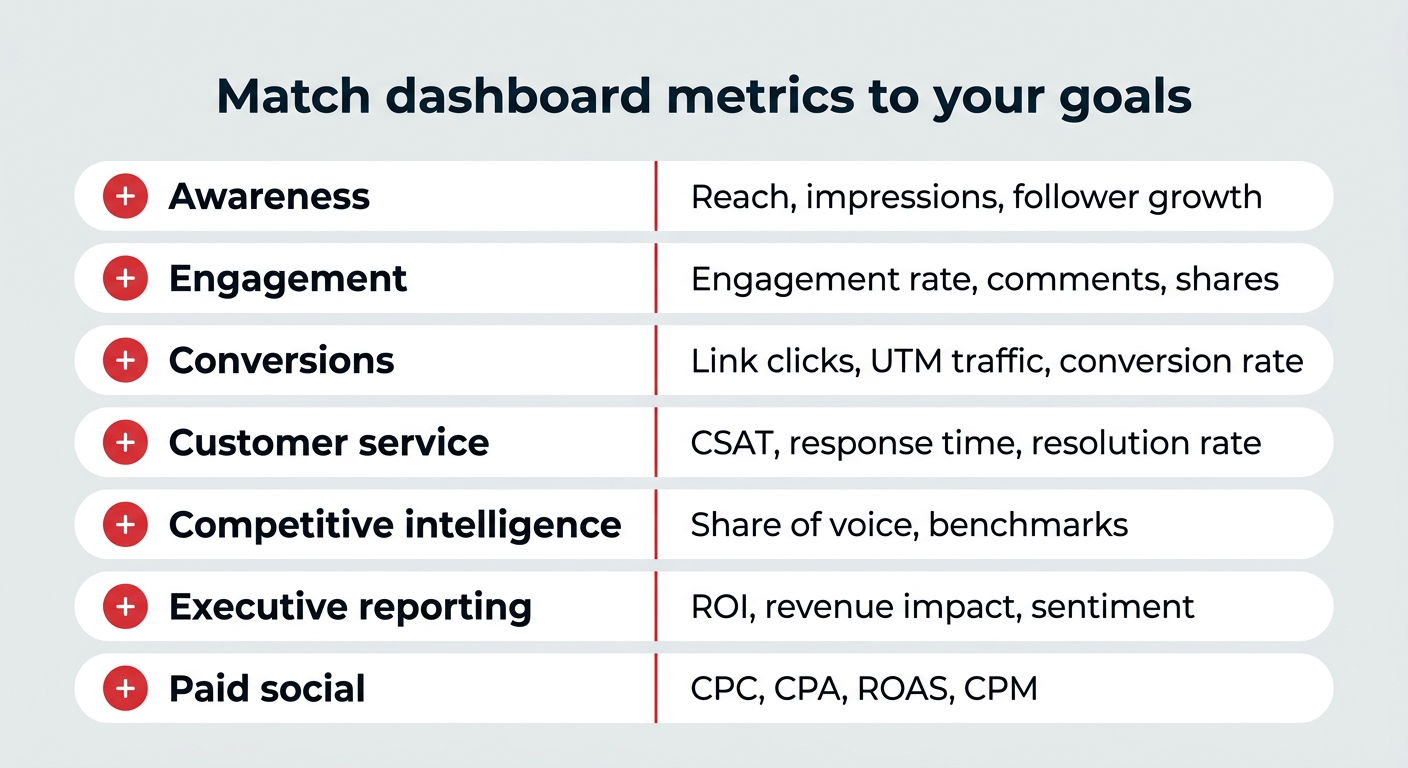
The most effective dashboards are those that map directly to specific business goals.
Brand Awareness and Competitive Intelligence
For many, the first step is a Brand Awareness Dashboard. This tracks reach, impressions, and follower growth. However, the most sophisticated teams augment this with Competitive Analysis. By tracking "Share of Voice" against competitors, brands can identify market gaps. If a competitor sees a spike in engagement on a specific topic, a competitive dashboard reveals that trend in real-time, allowing the brand to pivot its content strategy accordingly.
Social Customer Service
With 81% of customers expecting faster service as technology evolves, the Customer Service Dashboard has become a mission-critical tool. By tracking CSAT (Customer Satisfaction) scores and resolution rates, companies can monitor the effectiveness of their AI chatbots versus human agents. As Forrester warns, a third of companies currently risk damaging their brand reputation with poorly implemented AI self-service; a dashboard acts as the safety net, monitoring for customer frustration in real-time.
Employee Advocacy
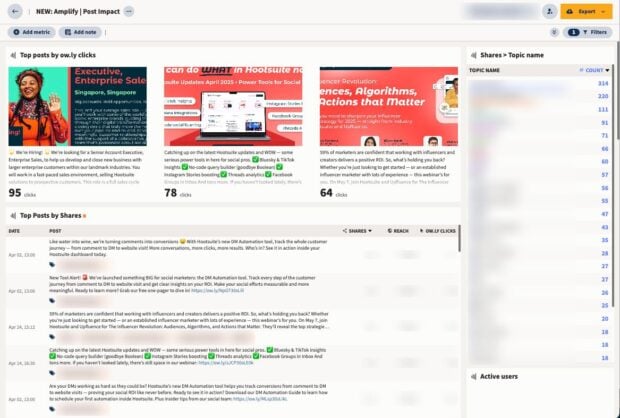
One of the most underutilized assets in a company is its own workforce. Employee Advocacy Dashboards track how often employees share company-approved content. This organic reach often yields higher engagement rates than paid ads because it leverages the trust inherent in peer-to-peer communication.
Implications: The "Build vs. Buy" Dilemma
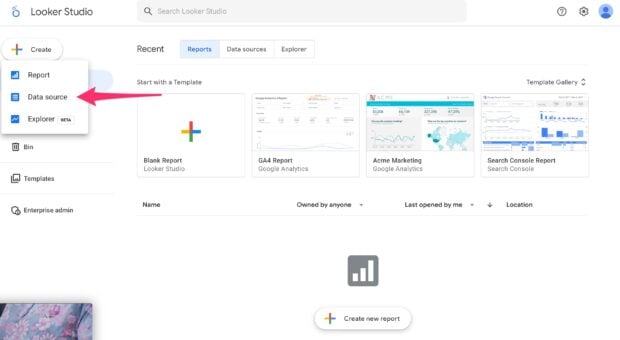
As teams scale, they face a critical choice: build a custom dashboard using tools like Google Looker Studio, or adopt an enterprise-grade "Social OS."
The Looker Studio Route
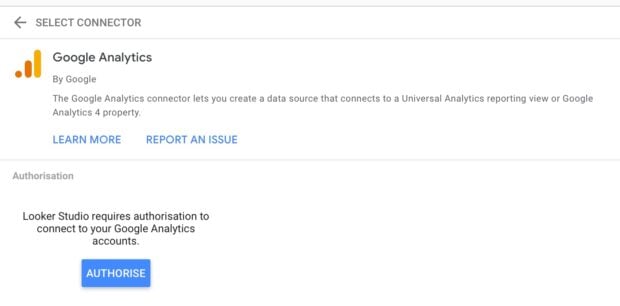
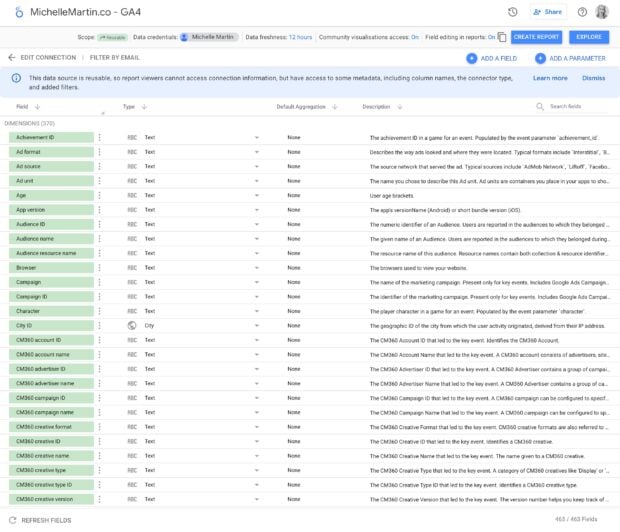
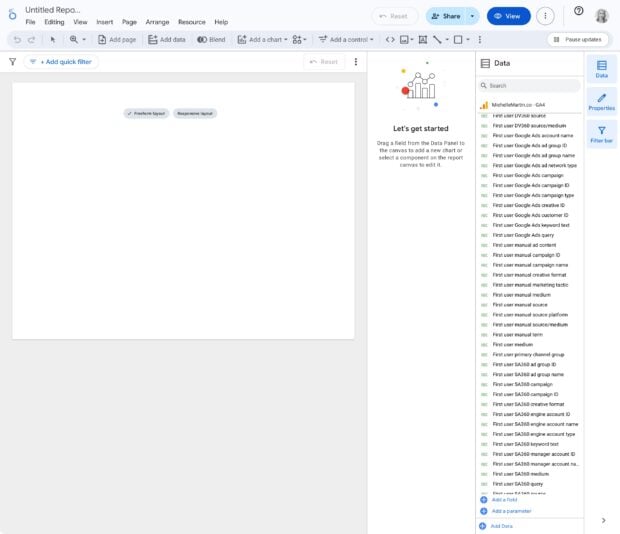
For budget-conscious teams with data-savvy analysts, Looker Studio offers immense flexibility. It allows for custom formulas, bespoke visualizations, and the ability to pull in data from almost any source. However, the tradeoff is significant:
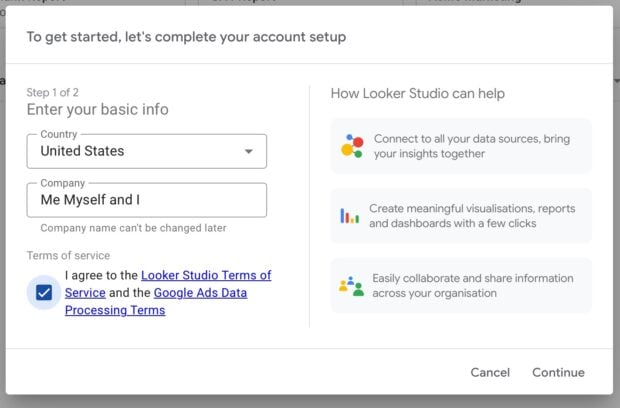
- Manual Maintenance: When a platform updates its API, your dashboard may break.
- Time Cost: The hours spent building and updating these reports are hours taken away from actual strategy.
The Connected System Route
Platforms like Hootsuite Social OS are designed for teams that prioritize operational efficiency. These systems offer:
- Pre-built Templates: Instant, professional-grade reports that evolve as platforms update.
- Holistic Workflows: The ability to see publishing, listening, and analytics in one place.
- Unified Data: Because the activity logs and the reporting modules share the same database, the data integrity is higher.
Conclusion: Making the Right Choice
Choosing the right dashboard is not just about picking a tool; it is about defining your team’s culture of accountability. If your goal is to grow your team’s influence, you must demonstrate the impact of your work with clarity.
For the modern marketer, the dashboard is no longer just a window; it is a steering wheel. Whether you are a small business tracking local engagement or a global enterprise managing thousands of social profiles, the ability to turn data into a story is the ultimate competitive advantage. As we move further into 2026, those who can synthesize, analyze, and act on their social data will be the ones who define the future of digital marketing.
Remember: A dashboard is only as useful as the decisions it supports. Keep it focused, keep it clean, and always ensure that your metrics are serving your business goals, not the other way around.
