
Beyond the Dashboard: How ‘Causality Reporting’ Is Bridging the Gap Between Business Strategy and Digital Impact
In the modern corporate ecosystem, data is abundant, but clarity remains a scarce resource. Marketing departments are often buried under a mountain of vanity metrics—impressions, click-through rates, and social media engagement—while business operations teams track supply chain shifts, product launches, and regional expansions. For years, these two worlds have operated in silos, leaving executives to guess whether a major corporate milestone actually moved the needle or if they were simply witnessing the ambient noise of a fluctuating market.
The central question that haunts every CMO and business strategist is: “Did that specific initiative actually change anything, or were we just lucky?”
Enter the Causality Report, an emerging analytical framework designed to bridge the chasm between real-world business events and digital performance metrics. By mapping specific, time-bound corporate actions against the volatile backdrop of digital data, the Causality Report transforms raw numbers into actionable narrative intelligence.
The Core Concept: What Is a Causality Report?
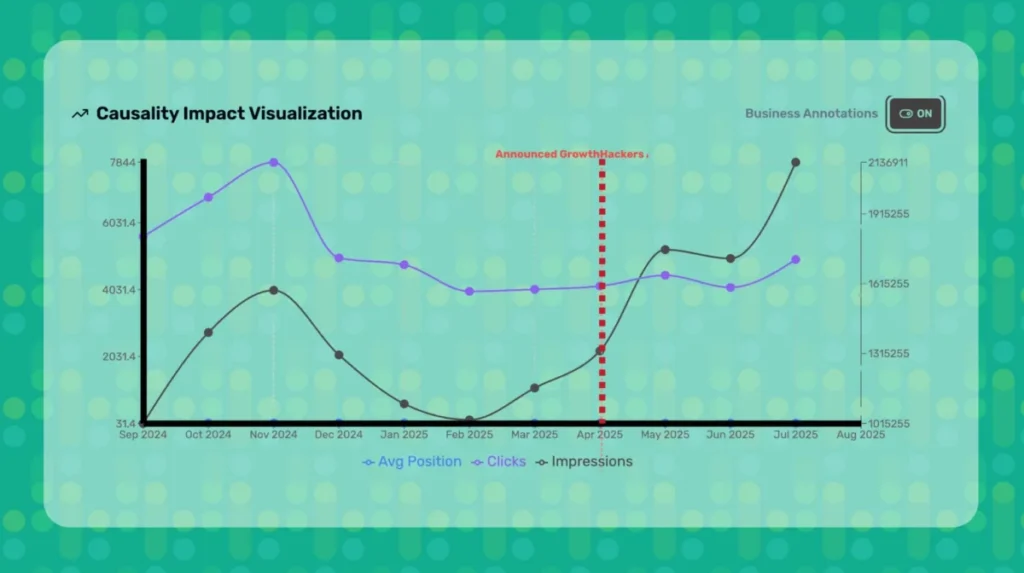
At its simplest, a Causality Report is a diagnostic tool that visualizes the "before-and-after" impact of a discrete business event. It moves beyond traditional correlation—which merely observes that two things happened at the same time—and aims to provide evidence of causation.
By annotating the exact date of a business event—such as a trade show exhibition, a rebranding campaign, or a change in pricing structure—the report allows stakeholders to observe the evolution of key performance indicators (KPIs) in the immediate aftermath. It serves as a visual ledger of cause and effect, providing a rigorous framework for evaluating the return on investment (ROI) of non-digital business activities.
The Mechanics of Annotation
The power of this reporting style lies in the "Business Annotations" toggle. When enabled, this feature overlays specific operational milestones onto digital performance charts. If a company launched a major product on April 15, 2025, that date is locked into the chart. Analysts can then track the ripple effects across organic search traffic, ad conversion rates, and brand sentiment scores. It is the difference between looking at a squiggly line on a graph and understanding why that line suddenly spiked.
A Chronology of Strategic Evolution
To understand the necessity of causality reporting, one must look at the evolution of business analytics over the last decade.
Phase 1: The Era of Descriptive Analytics (2010–2015)
During this period, businesses were primarily concerned with "What happened?" Dashboards were dominated by basic reporting tools that provided snapshots of traffic and sales. There was little context; if traffic dipped, teams scrambled to find reasons without a clear methodology.
Phase 2: The Rise of Predictive Analytics (2016–2020)
As machine learning entered the mainstream, companies began asking "What will happen?" Predictive modeling became the gold standard, though it often ignored the nuances of human-driven business decisions in favor of algorithmic patterns.
Phase 3: The Era of Causality (2021–Present)
We have now entered the age of "Why did it happen?" Leaders are no longer satisfied with forecasts; they demand proof of efficacy. The Causality Report represents the pinnacle of this shift, requiring a synthesis of operational data (the "what we did") and digital performance data (the "how the world reacted").
Supporting Data: When Signals Outweigh Noise
The efficacy of causality reporting is best illustrated through real-world scenarios where operational shifts create unmistakable signals in digital performance. Consider the following common scenarios:
1. The Post-Exhibition Surge
A B2B software firm spends six figures on a major industry exhibition. Traditionally, they measure success by "leads scanned." A Causality Report, however, tracks the lift in branded search traffic and whitepaper downloads in the weeks following the event. If the "Business Annotation" for the exhibition date coincides with a 30% jump in qualified leads, the causality is clear.
2. The PR Impact Analysis
When a company launches a high-stakes PR push, the immediate metrics—impressions—are often "noisy." A Causality Report filters out this noise by looking at long-term conversion shifts. Did the PR push result in a sustained increase in organic traffic? Or was it a fleeting spike? By annotating the PR launch, analysts can distinguish between a successful brand-building exercise and a wasted budget.
3. Supply Chain and Market Sentiment
For e-commerce giants, a disruption in the supply chain (e.g., a stockout of a best-selling item) can be mapped against customer support ticket volume and social media sentiment. This allows the company to see exactly how quickly customer trust erodes—and how long it takes to recover after stock is replenished.
Official Perspectives: Bridging the Silos
Industry experts argue that the greatest barrier to growth is not a lack of data, but the lack of communication between departments.
"When marketing and operations are decoupled, the company loses its pulse," notes one lead data strategist. "The Causality Report is the lingua franca that brings these teams together. It forces the operations team to tell marketing what they are doing, and it forces marketing to prove that their digital strategy is supporting those operations."
The shift toward causality also reflects a move away from "Vanity Metrics." CFOs are increasingly skeptical of reports that show "impressions" without a corresponding business outcome. By providing a clear, annotated timeline, firms can justify marketing spend by showing that it is not a cost center, but an accelerator for operational goals.
Implications: The Goldmine of Business Intuition
If you are not correlating your business actions with your digital data, you are essentially flying blind. The implications of adopting a causality-based mindset are profound:
- Optimized Budget Allocation: Stop funding initiatives that produce "noise" and double down on the events that create "signals."
- Cultural Alignment: When everyone in the organization sees the same annotated chart, it fosters a shared understanding of what drives success. The "marketing vs. ops" tension evaporates.
- Enhanced Strategic Agility: If a strategy is failing, a Causality Report reveals it within days, not months. You can pivot faster, saving both time and capital.
Turning Data Into Narrative Intelligence
The "Business Annotations ON" toggle is more than just a UI feature; it is a catalyst for storytelling. In boardrooms, data alone is dry. But when you present a chart that says, "On this date, we made this strategic move, and here is the immediate, measurable result," you are no longer just reporting metrics. You are telling the story of your business’s growth.
How to Implement Causality Reporting
For organizations looking to move toward this model, the process involves four critical steps:
- Standardize Data Collection: Ensure your operational team logs every major event (launches, price changes, PR hits) in a centralized calendar that is integrated with your data analytics platform.
- Establish Baselines: Before you can measure the "impact," you must understand the "normal." Establish a clear baseline for your KPIs during periods of business-as-usual.
- Use Annotations Rigorously: Do not limit annotations to "big" events. Even minor changes in marketing spend or website updates should be marked. Consistency is key to identifying subtle trends.
- Foster Cross-Functional Review: Hold monthly "Causality Reviews" where marketing, sales, and operations teams analyze the charts together. Ask the hard questions: Why did we spike here? Why did the trend line flatten there?
Conclusion: The End of Guesswork
The era of "set it and forget it" digital marketing is coming to a close. As markets become more competitive and consumer attention more fragmented, the ability to discern cause from coincidence will be the defining trait of successful organizations.
Causality reporting is the antidote to the "noise" of modern business. It allows leaders to strip away the vanity of high impression counts and look directly at the levers that move their bottom line. By integrating operational milestones with digital performance, you move from being a passenger to being a pilot.
You stop asking, "Did that move the needle?" and start knowing exactly how much it shifted. In a world of infinite data, that knowledge is the ultimate competitive advantage. It is time to turn your dashboard into a map, and your data into a clear, compelling narrative of growth.
