
Beyond the Dashboard: The Strategic Guide to Measuring Content Performance
Last Modified on March 19, 2025
If you believe measuring content performance is simply a matter of glancing at a monthly traffic report or checking your follower count, it is time to recalibrate. In the current digital landscape, superficial metrics—often referred to as "vanity metrics"—can provide a dangerously incomplete picture of your business health. True performance measurement requires a sophisticated, structured approach, the selection of high-impact Key Performance Indicators (KPIs), a deep understanding of what drives growth, and a baseline of technical competency.
In this comprehensive guide, we move beyond the basics to explore how to architect a content measurement framework that translates raw data into actionable business intelligence.
![How to Measure Content Performance [+Reports] (2025)](https://measureschool.com/wp-content/uploads/2025/03/how-to-measure-content-performance.png)
1. The Core Philosophy of Performance Measurement
To measure content effectiveness, you must first define the parameters of the "content space" you are analyzing. Content does not exist in a vacuum; it lives across a diverse ecosystem of websites, social platforms, and paid marketing channels.
Defining the Content Ecosystem
Effective measurement begins with categorization. We recommend segmenting your efforts into three distinct buckets:
- Owned Media (Websites): Content that lives on your domain, such as blog posts, landing pages, and product descriptions.
- Social Media: Content designed for community engagement and brand awareness on external platforms.
- Marketing Campaigns: Time-bound, objective-driven content such as email newsletters, paid ad copy, and whitepaper launches.
By segmenting your content, you avoid the mistake of comparing "apples to oranges." A viral tweet should not be measured using the same metrics as a long-form SEO article designed to capture high-intent search traffic.
![How to Measure Content Performance [+Reports] (2025)](https://measureschool.com/wp-content/uploads/2025/03/Meta-ad-library-example-1-1024x489.jpg)
2. The Measurement Plan: Your Strategic Roadmap
A Measurement Plan is the most important document in your data stack. It is a living, breathing blueprint that defines your objectives, identifies the metrics that correlate to those objectives, and sets benchmarks for success.
Why You Need a Measurement Plan
Without a plan, you will inevitably succumb to "analysis paralysis." Analytics platforms like Google Analytics 4 (GA4) or Meta Ads Manager contain thousands of data points. A plan helps you filter out the noise and focus on the signals that actually move the needle for your business. You can manage this easily in a shared document or a Google Sheet, ensuring that your team is aligned on what "success" actually looks like.
Essential Metrics by Channel
Website Metrics
- Active Users: The number of unique individuals engaging with your site.
- Page Views: The total volume of content consumption.
- Sessions: The frequency of interaction within a 30-minute window.
- Average Engagement Time: A critical metric that measures how long a user is truly focused on your content.
- Key Events (Goals): The specific actions—such as a newsletter sign-up or a purchase—that define ROI.
Social Media & Campaign Metrics
- Reach & Impressions: The breadth of your content’s visibility.
- Engagement Rate: A calculation of likes, comments, and shares relative to reach.
- Click-Through Rate (CTR): The efficiency of your call-to-action (CTA).
- Conversion Rate: The percentage of users who complete the desired action after clicking.
3. Benchmarking: Contextualizing Your Success
Data without context is meaningless. To understand if your content is "performing well," you must establish a baseline.
![How to Measure Content Performance [+Reports] (2025)](https://measureschool.com/wp-content/uploads/2025/03/SpyFu-example-1024x518.png)
Identifying Internal Trends
Start by calculating your weekly and monthly averages. If your blog currently attracts 2,000 users per month, that is your baseline. When setting future goals, use this as your foundation. For instance, a 30% growth target is mathematically easier to track if you know your current average is 500 users per week.
External Benchmarking
Once you understand your internal velocity, compare yourself to the broader market. Benchmarking against competitors helps you identify if a dip in performance is a systemic issue in your industry or a specific failure in your content strategy. Tools such as Meta Ad Library for creative research or SpyFu for competitive SEO analysis are essential for understanding the "why" behind your competitors’ success.
4. Scaling Your Analytics: From Silos to Holistic Views
When you are a small team, tracking each platform individually is manageable. As your content operation scales, however, manual reporting becomes a bottleneck. This is where you must transition from manual spreadsheets to an integrated Content Performance Report.
![How to Measure Content Performance [+Reports] (2025)](https://measureschool.com/wp-content/uploads/2025/03/Wix-traffic-overview-1024x524.jpg)
The Anatomy of an Effective Report
Your reporting suite should be automated to answer repetitive questions instantly. Rather than digging through individual platform dashboards, your reports should answer the following:
- Which pages are the "entry points" (Landing Pages) for the majority of our traffic?
- Where are users experiencing friction or "looping" behavior?
- Which search queries are driving the most high-value traffic?
The Power of Google Analytics 4
GA4 has transformed how we look at user behavior. By leveraging the Landing Page Report, you can identify first impressions. If a page has high traffic but low engagement, it signals a disconnect between your content’s promise and its delivery. Furthermore, the Path Exploration tool allows you to visualize user journeys, helping you identify bottlenecks where users become frustrated and abandon your site.
Search Console: The SEO Gold Standard
The Performance report in Google Search Console is indispensable. Unlike standard web analytics, it shows you exactly which queries triggered your site to appear in search results. This provides a direct line of sight into the intent of your audience—are they looking for information, or are they ready to buy?
![How to Measure Content Performance [+Reports] (2025)](https://measureschool.com/wp-content/uploads/2025/03/GA4-landing-page-report-1024x492.png)
5. Customization: Making Data Work for You
Standard reports are useful, but they are rarely enough. Customization is where the real competitive advantage lies.
In tools like GA4, you can:
- Apply Filters: Focus on specific traffic segments, such as organic search vs. paid social.
- Add Secondary Dimensions: Break down your traffic by source, medium, or even geography.
- Build Explorations: Create "what-if" scenarios that allow for deep-dive investigations into user behavior.
If you are not using custom reports, you are likely missing the nuances that explain why your content is or isn’t performing.
![How to Measure Content Performance [+Reports] (2025)](https://measureschool.com/wp-content/uploads/2025/03/GA4-Pages-and-screens-report-1024x490.png)
6. Automating for Efficiency: Templates and Multi-Channel Reporting
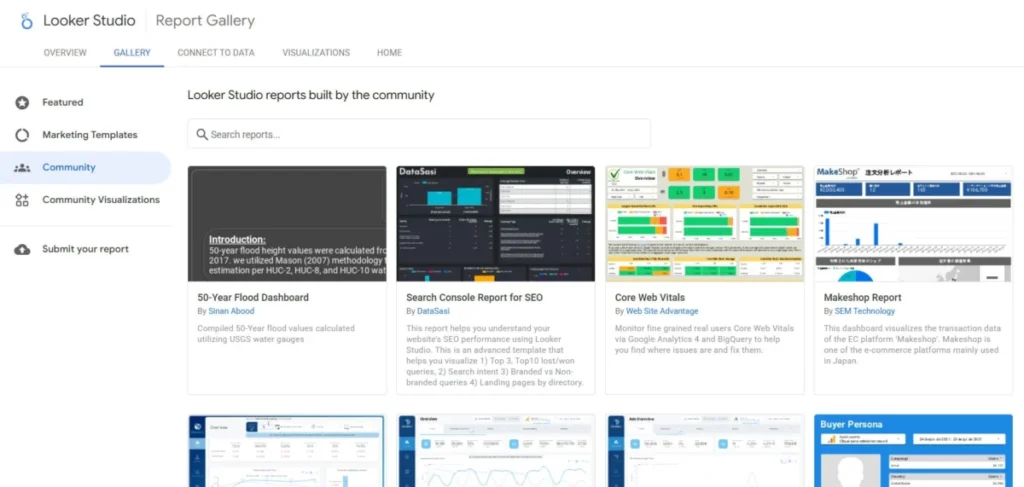
The most successful marketing teams do not build reports from scratch. They use Report Templates. The Looker Studio gallery, for example, offers hundreds of pre-configured dashboards that can be connected to your data sources in minutes.
The Multi-Channel Imperative
In a world where a customer might discover your brand on TikTok, research you on Google, and finally convert via an email link, siloed data is a liability.
Multi-channel reporting tools like Supermetrics or Coupler.io act as the bridge between your various platforms (CRM, Social, Web Analytics) and your visualization tool (Tableau, Power BI, or Looker Studio). By centralizing this data, you gain a "holistic view" of your content’s impact. This is the difference between knowing that a blog post got 100 views and knowing that a blog post was the first touchpoint in a journey that resulted in $5,000 of revenue.
![How to Measure Content Performance [+Reports] (2025)](https://measureschool.com/wp-content/uploads/2025/03/Search-console-report-1024x656.png)
7. Implications: The Data-Driven Future
The implications of a robust measurement framework are profound. First, it eliminates the "gut feeling" approach to content creation. When you can prove which formats, topics, and channels drive revenue, you can confidently allocate your budget toward the highest-performing areas.
Second, it fosters a culture of accountability. When every team member understands that their content is being measured against specific KPIs, the focus shifts from "producing content" to "producing effective content."
Finally, it allows for agility. In a fast-moving market, the ability to identify a downward trend in real-time—and pivot your strategy accordingly—can be the difference between growth and obsolescence.
![How to Measure Content Performance [+Reports] (2025)](https://measureschool.com/wp-content/uploads/2025/03/Explorations-in-GA4-1024x551.png)
Summary: Your Next Steps
Measuring content performance is not a one-size-fits-all endeavor. It is a continuous, iterative process of defining objectives, selecting the right metrics, benchmarking against the market, and refining your reporting through automation and customization.
By moving beyond simple vanity metrics and building a structured, multi-channel measurement plan, you transform your content from a cost center into a powerful engine for business growth.
What methods are you currently using to measure your content? Have you found a particular KPI or automation tool that changed your workflow? We invite you to share your experiences in the comments below. Your insights help the entire community move toward a more data-driven and results-focused future.
