
Beyond the Vanity Metric: How Causality Reporting is Rewriting the Playbook for Business Intelligence
In the modern corporate ecosystem, data is often treated as a vast, unruly ocean. CMOs, product leads, and operations directors are bombarded with dashboards, real-time tracking, and bottomless spreadsheets. Yet, a fundamental, gnawing question persists in boardrooms across the globe: "Did that initiative actually move the needle, or were we simply riding a tide of market momentum?"
For years, the industry has relied on correlation—the loose assumption that because a marketing campaign ran concurrently with a spike in traffic, the two are linked. But correlation is not causation, and in an era of tightening budgets and high-stakes performance marketing, "close enough" is no longer a viable strategy. Enter the Causality Report: a sophisticated analytical framework designed to bridge the chasm between real-world business maneuvers and digital performance outcomes.
The Core Problem: The Silo of Intent and Outcome
Historically, organizations have operated under a bifurcated model. On one side, there is the "Business Operations" track—product launches, physical trade shows, PR blitzes, and strategic partnerships. On the other, the "Digital Performance" track—Google Analytics, ad impressions, click-through rates, and conversion funnels.
Too often, these two tracks exist in parallel, rarely intersecting except during end-of-quarter autopsy reports. When a business leader asks, "Did the April exhibition move the needle?", the marketing team pulls a report that shows a traffic spike, while the operations team points to a successful event. Neither side can definitively prove the causal link. The Causality Report changes this dynamic by transforming data from a passive observer into an active, evidence-based narrative.
Defining the Causality Report: What Is It?
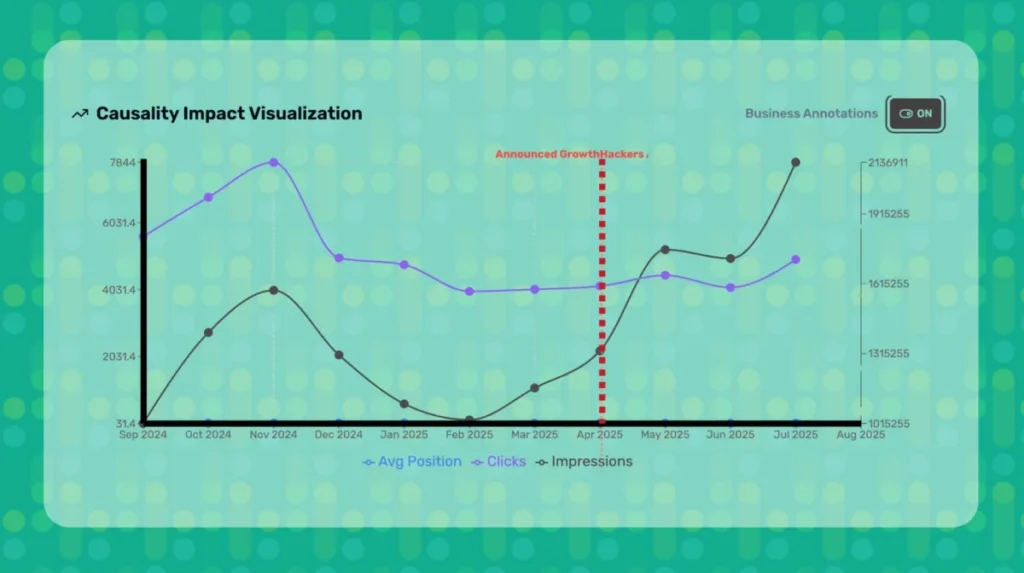
A Causality Report is more than a visualization; it is a diagnostic tool that maps the "before-and-after" impact of specific, high-intent business events. By annotating the exact date—or timeframe—of a business milestone, the report overlays that action directly onto digital performance metrics.
Instead of looking at a generic upward trend line, stakeholders can see the precise moment the trajectory shifted. Whether it is an offline industry event, a change in pricing structure, a high-profile influencer partnership, or a major UI update, the Causality Report anchors these events in the timeline of digital performance. It provides the evidence required to move from speculative reporting to strategic foresight.
Chronology: A Case Study in Strategic Impact
To understand the utility of this reporting, consider the trajectory of a company that implemented "Business Annotations" in early 2025.
The Pre-Event Baseline (January – March 2025)
During the first quarter, the company’s digital metrics showed steady, albeit incremental, organic growth. Ad performance was plateauing, and impressions were largely tied to seasonal search volume. There was no clear outlier in the data; the performance was predictable and, frankly, stagnant.
The Catalyst (April 2025)
In April, the company executed a multi-faceted business intervention: a major industry exhibition combined with a coordinated PR push. Historically, this would have been recorded as a "successful event" based on attendance. However, by enabling the "Business Annotations" feature, the company mapped these activities directly onto their CRM and web traffic data.
The Immediate Aftermath (Post-April 2025)
The results were immediate and undeniable. Within 48 hours of the exhibition, the Causality Report displayed a distinct "step-change" in digital engagement. Impressions didn’t just rise; they entered a new, higher-performing baseline. Click-through rates on specific product pages saw a sustained lift that did not taper off as it had in previous, non-annotated quarters.
This chronology demonstrates that the exhibition was not merely a marketing expense; it was a catalyst for sustained digital growth. By visually aligning the event with the data, the organization proved that their offline actions were directly driving online intent.
Supporting Data: Moving from Correlation to Evidence
The power of the Causality Report lies in its ability to filter out "market noise." In any given month, external factors—competitor moves, seasonal shifts, or global economic trends—can skew data.
When a company applies a causality overlay, they are essentially performing a controlled experiment. If a firm launches a new pricing tier and simultaneously sees a 15% increase in conversion, a standard dashboard shows the increase. A Causality Report, however, allows the analyst to see if that 15% increase happened only among users who engaged with the updated pricing page, or if it was a site-wide fluctuation.
This level of granularity is the difference between "getting lucky" and "executing a strategy." The data reveals that:
- Direct Impact: Specific actions lead to predictable spikes in specific segments.
- Delayed Impact: Some actions, like a long-form content release, show a delayed but significant surge in SEO authority.
- Null Impact: Occasionally, the data reveals that a high-cost event had zero correlation to digital performance, signaling that the company is wasting resources on ineffective channels.
Official Perspectives: The Shift Toward Narrative Intelligence
Industry leaders are increasingly adopting this methodology. According to experts in data architecture, the shift is driven by the demand for "Narrative Intelligence."
"Reporting metrics is a commodity," says a lead analyst at a global marketing firm. "Anyone can pull a chart. But the ability to say, ‘We did X, which caused Y, leading to a Z% increase in ROI’—that is the language of the boardroom. The Causality Report turns a spreadsheet into a business story. It allows teams to defend their budget and double down on what actually works."
This shift has profound implications for corporate culture. When teams are forced to map their actions to outcomes, accountability increases. It discourages "vanity metrics"—like social media likes or generic impressions—and encourages the tracking of "impact metrics"—like qualified lead velocity or cost-per-acquisition efficiency.
Implications: Why You Are Leaving Intelligence on the Table
If your organization is not correlating business actions with digital outcomes, you are operating in the dark. The implications of this data gap are significant:
- Inefficient Resource Allocation: Without causality data, budgets are often allocated based on "the way we’ve always done it," rather than on proven ROI.
- The "Innovation Gap": When you cannot measure the success of an experiment, you cannot iterate on it. This leads to stagnation, where companies repeat the same marketing cycles without ever refining their approach.
- Loss of Executive Trust: When CMOs cannot explain why a dip in performance occurred—or why a spike happened—they lose the credibility required to lead long-term strategic initiatives.
Strategic Applications: When to Deploy the Causality Report
Organizations should integrate causality reporting into their standard operating procedures for the following scenarios:
- Product Launches: To measure the immediate digital footprint left by a new product introduction.
- PR and Brand Campaigns: To determine if high-cost PR efforts actually translate to direct-to-site traffic or just "vanity" buzz.
- Pricing Strategy Shifts: To identify the exact moment a price change influences user behavior and sales velocity.
- Competitive Responses: To track how a competitor’s move (or your response to it) impacts your market share in real-time.
- Offline-to-Online Events: To quantify the efficacy of physical trade shows, seminars, or pop-up events on digital engagement.
The Future of Business Intuition
The "Business Annotations ON" toggle represents a fundamental shift in how we view the relationship between the physical world and the digital one. It is the bridge between human intuition and machine-learned data.
We have reached a stage where we no longer need to wonder if a campaign moved the needle. The tools exist to track the ripple effects of every major business decision. By adopting the Causality Report, companies stop being passive consumers of their own data and start becoming active architects of their performance.
In an increasingly competitive landscape, the winners will be those who can connect the dots faster than their peers. The era of guessing is over. The era of evidence-based storytelling has begun. It is time to turn your data into a narrative—and your narrative into a strategy that delivers real, measurable, and sustainable impact.
