

The Architecture of Conversion: 10 Essential Metrics for Landing Page Optimization
Last Modified on March 19, 2025
In the vast digital marketplace, your website is your storefront, and your landing pages are the display windows. Just as a physical shop’s window display determines whether a passerby becomes a customer or keeps walking, a landing page serves as the digital "make or break" moment for your brand. Because a landing page is often the first—and potentially last—point of contact for a user, its efficacy is a primary driver of business success.
Digital marketers invest significant capital into driving traffic through sophisticated ad campaigns and SEO strategies. Yet, without a robust framework to measure what happens once that traffic arrives, those investments can quickly evaporate. Understanding landing page performance is not merely an analytical exercise; it is the cornerstone of modern digital growth.
This guide explores the ten essential metrics that every marketer must track to transform passive visitors into active participants, regardless of the analytics platform in use.
1. The Foundation: Traffic Sources
While not a performance metric in itself, segmenting your data by Traffic Source is the lens through which all other metrics gain meaning. Before diving into conversion rates or bounce statistics, you must understand where your visitors originate.

By analyzing metrics through the prism of traffic sources—such as Paid Search, Paid Social, Organic Search, or Email—you gain actionable insights into channel efficacy. For example, if your Paid Search campaigns yield a high cost but low conversion rate compared to Paid Social, the data provides a clear mandate: reallocate your budget. Furthermore, poor performance from a specific source often signals a disconnect between the ad creative and the landing page content, prompting a necessary review of your messaging alignment.
2. Conversion Rate (CR)
The ultimate objective of any landing page is to facilitate a specific action, whether it is a form submission, a whitepaper download, or a product purchase. The Conversion Rate (CR) is the primary indicator of your page’s success.
The Formula: (Total Conversions / Total Visitors) 100*
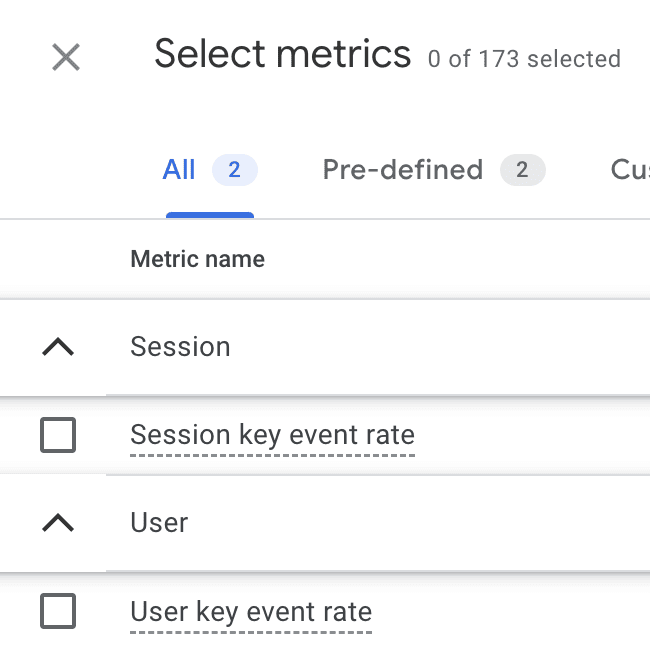
To derive meaningful insights, compare your CR against industry benchmarks. However, exercise caution: conversion rates are highly susceptible to nuances such as price point, geographical location, and the maturity of your brand. In Google Analytics 4 (GA4), you can leverage "Key Event Rates" to monitor how effectively your page guides users toward your desired business outcomes.
3. Bounce Rate: Measuring Initial Engagement
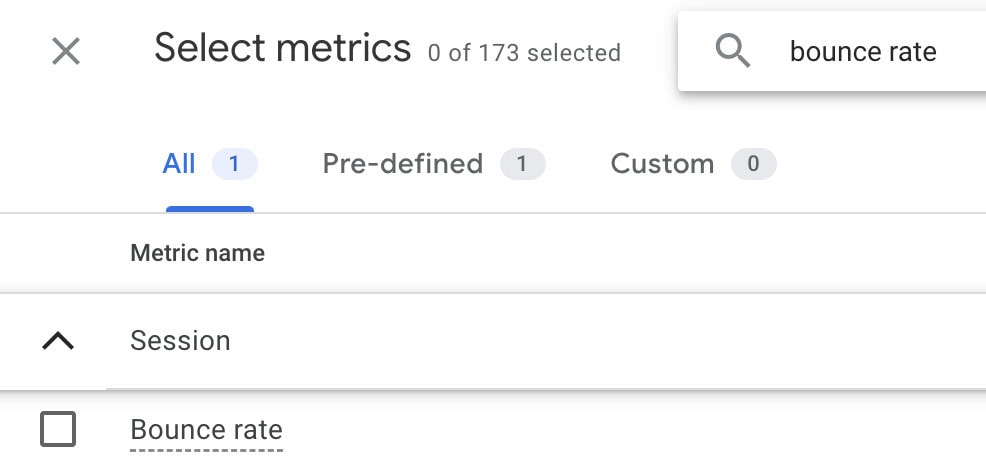
The Bounce Rate represents the percentage of users who land on your page and depart without performing any secondary interaction.
The Formula: (Sessions with one page / Total Sessions) 100*
A high bounce rate is a red flag, indicating that your page may be failing to meet user expectations. It prompts critical questions: Is the page loading too slowly? Is the headline misleading? Does the design feel untrustworthy? While industry averages generally hover between 26% and 70%, context is vital—blog posts naturally have higher bounce rates than high-intent sales pages. If your bounce rate drops below 20%, it is prudent to audit your tracking implementation, as this may indicate a technical error in your analytics setup.
4. Average Time on Page
This metric provides a glimpse into the quality of engagement. However, it must be interpreted through the context of your business model.
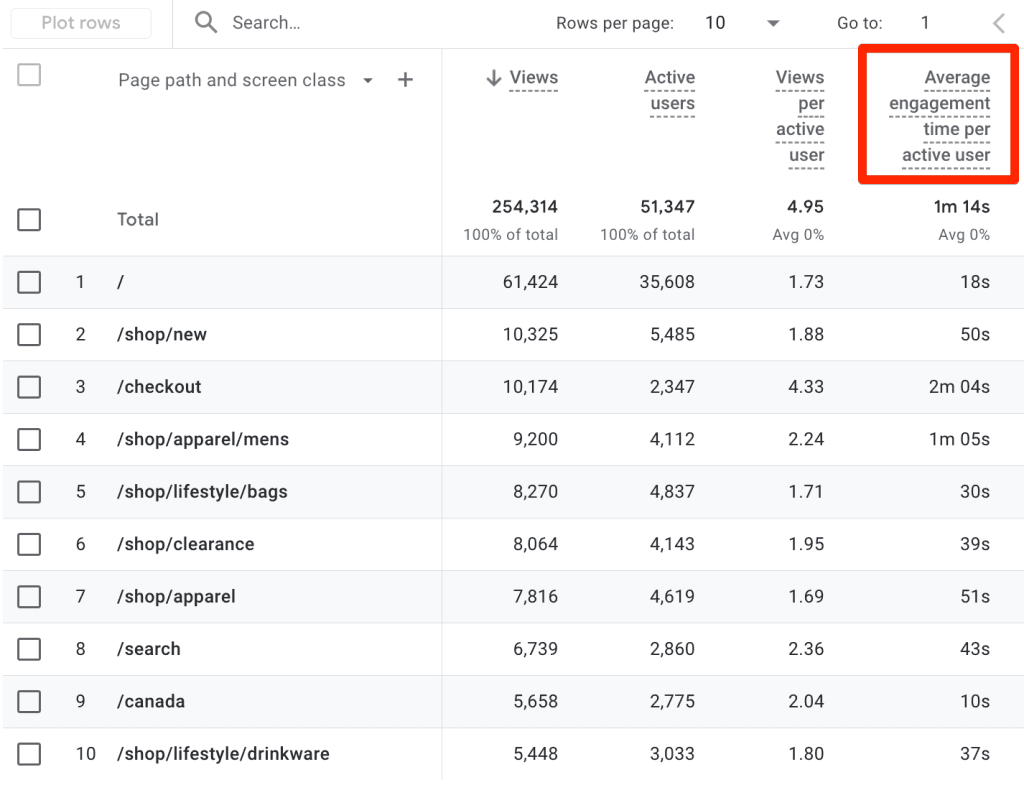
For high-value, complex services, a longer time on page suggests that the user is performing due diligence. Conversely, if your landing page is designed for a quick conversion—such as a simple email capture—a high average time might indicate that users are confused by the layout or unable to find the Call-to-Action (CTA). In GA4, "Average Engagement Time" is the standard metric to track, offering a more nuanced view of active user interaction rather than simple duration.
5. Form Abandonment Rate
For lead-generation pages, the form is the final hurdle. The Form Abandonment Rate reveals the friction points in your data collection process.
The Formula: (Form started – Form completions) / Form started 100*
A high abandonment rate is a clear signal that your form is likely too long, asks for intrusive information, or suffers from technical glitches. By optimizing field requirements and improving the user interface, you can drastically increase the number of qualified leads captured from the same amount of traffic.
6. Cost Per Conversion (CPC)
Marketing is a financial investment, and the Cost Per Conversion is the metric that determines your return on investment (ROI).
The Formula: Marketing Cost / Total Conversions
If you are spending $2,500 to acquire 121 conversions, your cost per conversion is $20.67. This figure must be measured against the Customer Lifetime Value (CLV). If your cost per conversion consistently exceeds the value of the lead or sale, your landing page strategy is unsustainable and requires immediate recalibration.
7. Exit Rate: The End of the Journey
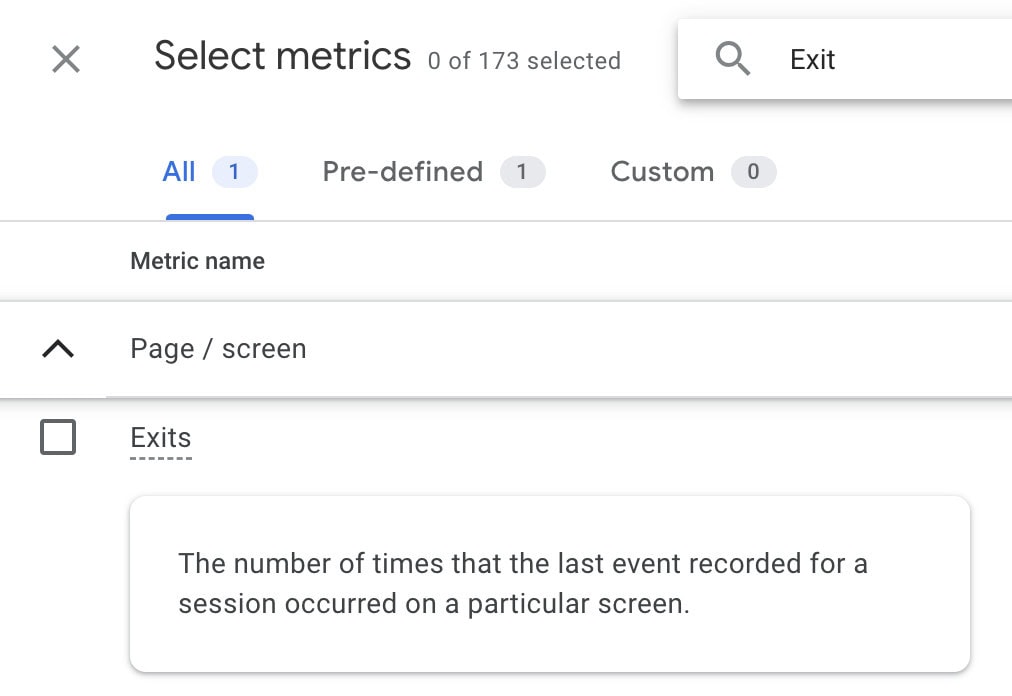
While often confused with the bounce rate, the Exit Rate measures the percentage of users who leave your site after visiting any number of pages.
The Formula: (Number of Exits / Total Pageviews) 100*
If your landing page is the final step in a funnel, a high exit rate is expected. However, if the page is intended to be an intermediary step, a high exit rate indicates a failure to guide the user to the next stage of the customer journey. Distinguishing between a "bounce" (the first and only page) and an "exit" (the last of many) is essential for identifying where in your site architecture users are losing interest.
8. Scroll Depth: Beyond the Fold
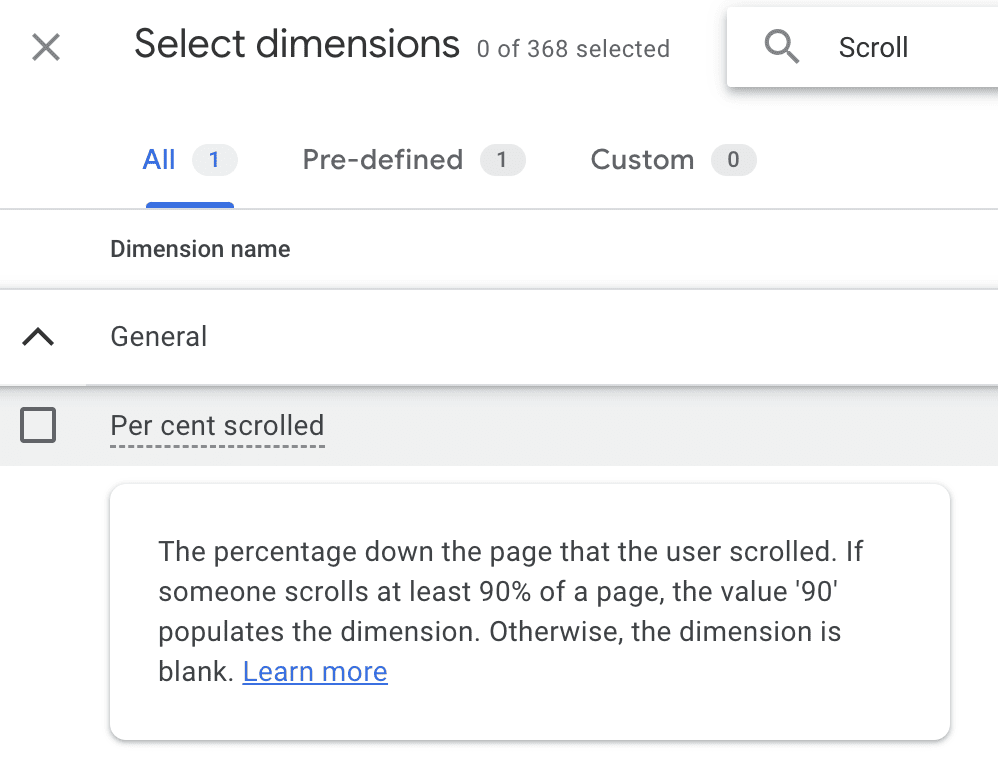
Scroll Depth measures how far users traverse down your page. In an era of long-form landing pages, this metric is critical.
By tracking scroll milestones (25%, 50%, 75%, 100%), you can determine if your most important elements—such as CTAs, testimonials, and security badges—are actually being seen. If your scroll depth data shows that 90% of users never reach the bottom of the page, your most vital conversion assets should be moved "above the fold" or into the initial viewing area.
9. Click-Through-Rate (CTR)
The CTR measures the effectiveness of specific interactive elements on your page, such as buttons or links.
The Formula: (Total Clicks / Total Impressions) 100*
A high CTR indicates that your copy is persuasive and your design is intuitive. A sudden decline in CTR, however, often acts as an early warning system for technical failures, such as broken links or unresponsive buttons, allowing you to address issues before they cause significant revenue loss.
10. New vs. Returning Visitors
Analyzing behavior through the lens of visitor loyalty allows for hyper-personalized marketing.
If new visitors bounce at a high rate, your landing page likely fails to communicate your value proposition clearly. Conversely, if returning visitors exhibit a high bounce rate, they may be struggling to find information they previously viewed. By pairing this data with session recordings, you can identify the "whys" behind the "whats," creating a feedback loop that continually refines the user experience.
Implications for Strategic Optimization
The Role of Qualitative Data
Metrics provide the what, but they rarely provide the why. To truly optimize a landing page, you must integrate quantitative metrics with qualitative data. Tools like Hotjar or Microsoft Clarity provide heatmaps and session recordings that reveal exactly how users interact with your interface.
Official Perspectives on Analytics
Industry experts emphasize that metrics are not just numbers to be reported; they are tools for hypothesis testing. Whether you are using GA4 or a proprietary dashboard, the goal remains the same: identify friction, test a solution (A/B testing), and measure the delta.
A Continuous Cycle
The process of landing page optimization is not a one-time project but a continuous cycle of:
- Measurement: Establishing baseline metrics.
- Diagnosis: Identifying underperforming channels or sections.
- Hypothesis: Formulating a theory for improvement (e.g., "Shortening the form will increase conversions").
- Execution: Implementing changes.
- Review: Evaluating the impact of those changes against your baseline.
By consistently applying this framework, organizations can shift from guesswork to a data-driven culture. While the metrics outlined here provide a robust starting point, remember that your specific industry and audience will dictate which KPIs deserve the most attention. The most successful landing pages are those that treat every visitor as an opportunity for learning, ensuring that the digital storefront is always optimized for the modern shopper.
