
Decoding the User: A Comprehensive Guide to Unique Visitors in Google Analytics 4
Last Modified: March 26, 2025
In the vast landscape of web analytics, the sheer volume of metrics—Total users, active users, sessions, bounce rates, and conversion paths—can be overwhelming. For digital marketers and business owners, the confusion often begins with the most fundamental question: Who exactly is visiting my website?
While "unique visitors" was the cornerstone of legacy analytics, the terminology and methodology have evolved significantly with the advent of Google Analytics 4 (GA4). To perform meaningful analysis, one must move beyond surface-level numbers and understand the underlying logic of how Google identifies, tracks, and categorizes human behavior across the digital ecosystem.
The Evolution of the "Unique Visitor" Metric
Historically, web analytics relied on the concept of the "Unique Visitor"—a metric designed to count an individual person regardless of how many times they returned to a site. However, in the modern era of multi-device browsing, this definition has become increasingly complex.

In GA4, the term "unique visitor" is not a standalone metric. Instead, Google has shifted toward two primary metrics: Total Users and Active Users. Understanding the distinction between these two is the first step toward accurate data interpretation.
Total Users vs. Active Users
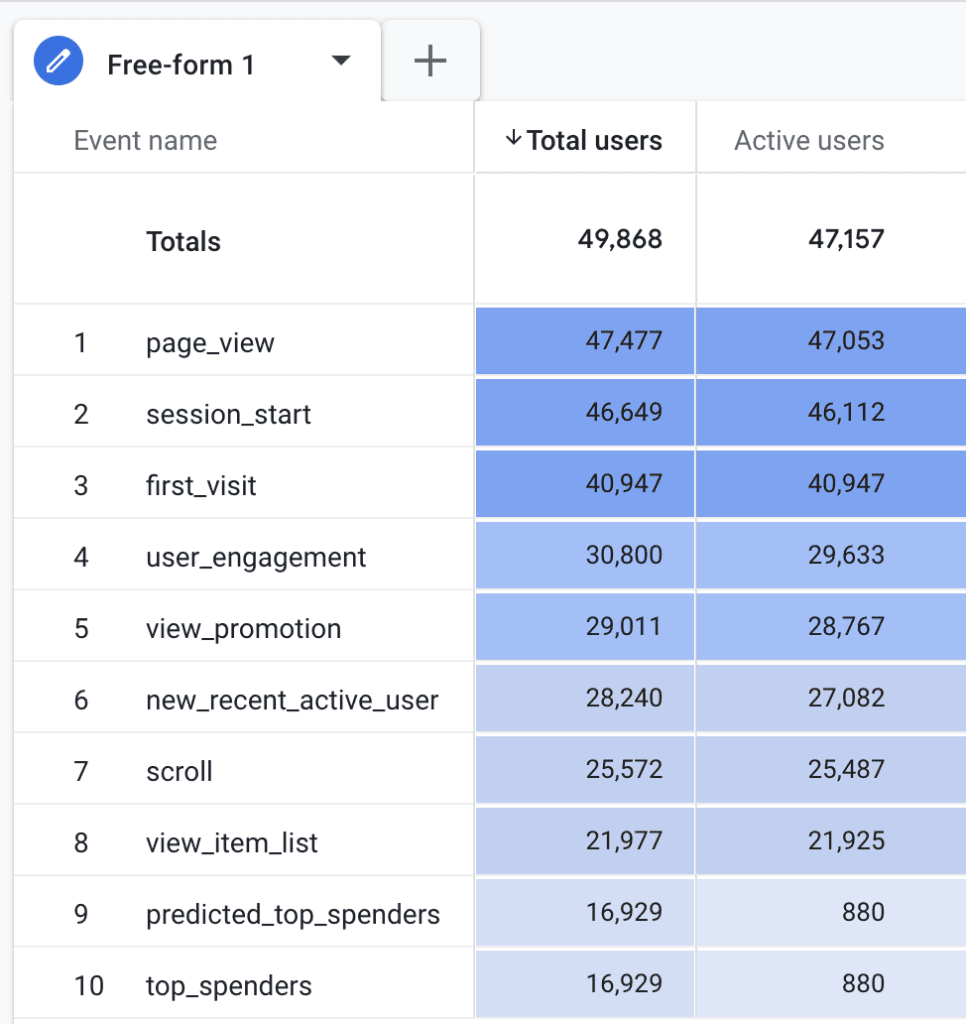
- Total Users: Defined as the number of unique users who have triggered any event on your site or app during a specific date range. Whether it is a page view, a scroll, or a button click, the firing of an event logs a user ID.
- Active Users: This is the metric Google Analytics 4 prioritizes. An "Active User" is defined as a user who has had an "engaged session" or triggered specific engagement events.
An engaged session is defined by one of three criteria:
- The session lasted longer than 10 seconds.
- The session included a conversion event.
- The session included two or more page views or screen views.
Because these criteria are relatively easy to meet, the numbers for Total Users and Active Users often appear quite similar. However, the nuance lies in the quality of the interaction, rather than the mere existence of a visit.
Technical Foundations: How GA4 Tracks Identity
The engine driving these metrics is the Client ID (CID). When a user visits a website, GA4 stores a unique, randomly generated identifier in a first-party cookie named _ga. This identifier allows Google to recognize if a visitor is returning or if they are encountering the site for the first time.
The Lifecycle of the Client ID
By default, the _ga cookie has a two-year expiration. However, this is not a static rule. Privacy regulations and browser-level restrictions—particularly on Apple’s iOS—have significantly shortened this lifespan. In some instances, Safari may limit cookie storage to as little as 24 hours. When a cookie is cleared, deleted by an ad blocker, or expires, the user is reset to "new" status upon their next visit.
Crucially, the Client ID is device-specific. If a user visits your site on a smartphone and later on a desktop, GA4 will treat them as two distinct users. This creates a "fragmented" view of the customer journey, a limitation that remains one of the most significant hurdles in modern attribution modeling.
Navigating the GA4 Interface: Where to Find Data
GA4 integrates user metrics across its reporting suite. To extract value, practitioners should look toward these 18 key locations:
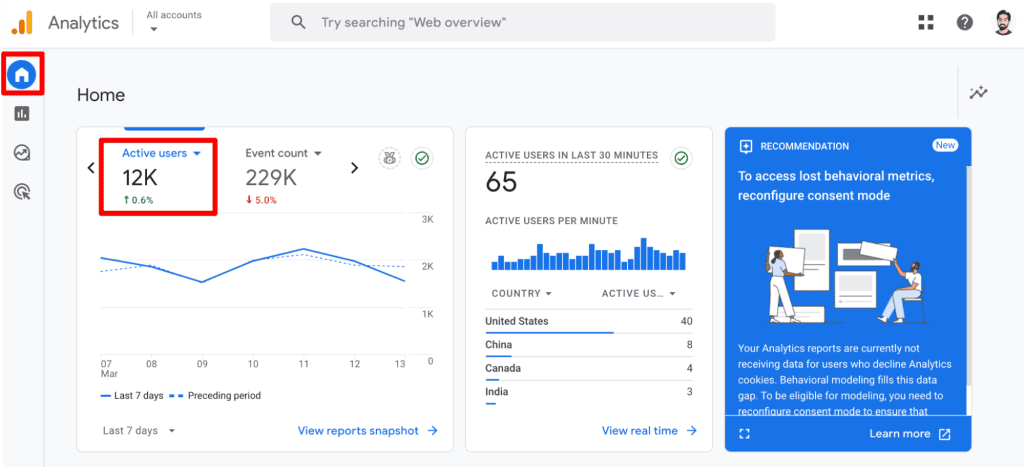
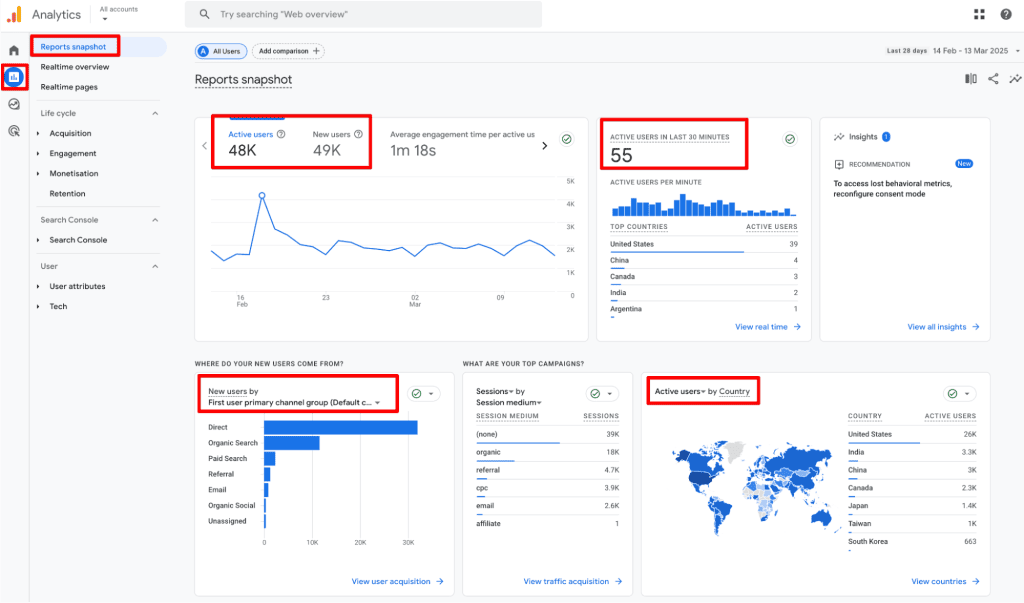
- Home & Reports Snapshot: High-level views of Active and New users.
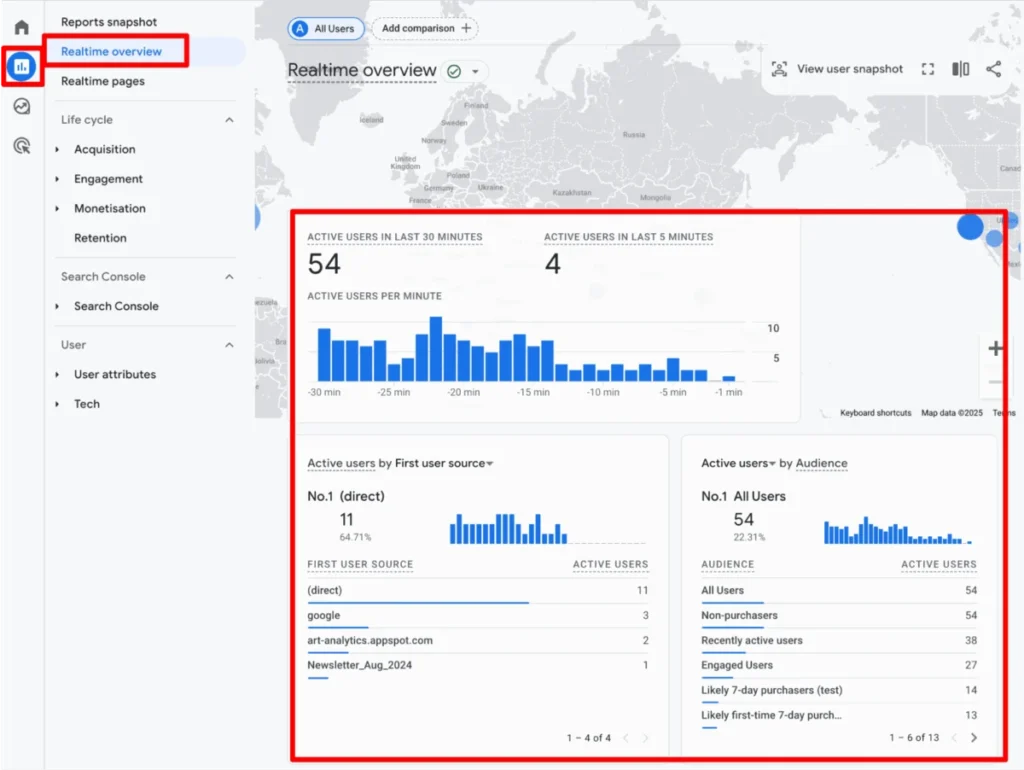
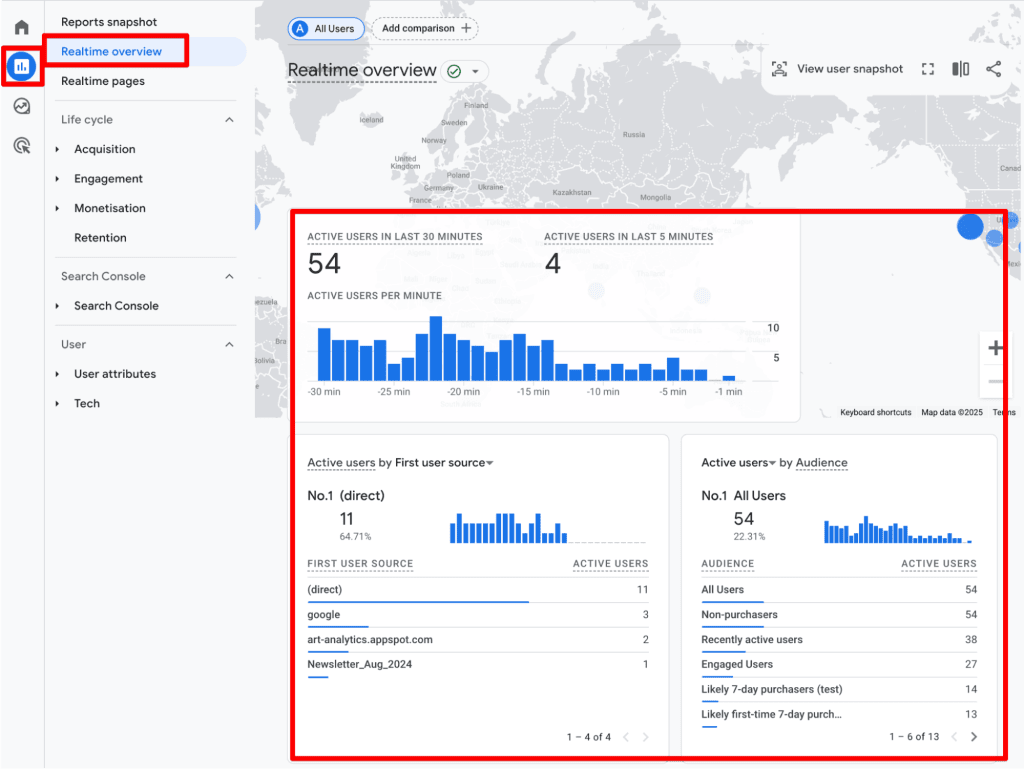
- Realtime Overview & Realtime Pages: Immediate insights into what users are doing within the last 30 minutes.
- Acquisition & Engagement Overviews: Cards displaying user growth and behavior.
- User Acquisition Reports: A breakdown of Total, New, and Returning users.
- Events & Pages: Specific reports that map user activity to content performance.
- eCommerce & Retention: Behavioral reports that track the lifecycle of a customer.
- Explorations: For advanced analysts, the "Explore" tab allows for custom, granular analysis where standard reports fall short.
Best Practices for Data Integrity
To avoid the common pitfalls of inaccurate reporting, consider these strategic best practices:
1. Guard Against Data Duplication
If GA4 is installed via multiple methods—such as a hard-coded script, a plugin, and Google Tag Manager simultaneously—you risk double-counting events. Periodically audit your tracking setup to ensure data flows through a single, clean pipeline.
2. Implement Custom Insights
Do not wait for a quarterly review to discover a drop in traffic. Use GA4’s Custom Insights feature to set up automated alerts. If Active users drop by 20% in a 24-hour period, you should be notified immediately via email to investigate potential technical failures or broken links.
3. The Danger of Summation
A common error is attempting to sum users across different days to calculate a monthly total. Because a single user may visit on multiple days, summing daily totals will lead to an inflated figure. Always rely on GA4’s built-in aggregation over your own manual addition.
4. Segmenting for Strategy
User counts in isolation are vanity metrics. Use segments to answer qualitative questions:
- How do users from organic search behave differently than those from paid social?
- Do mobile users have higher bounce rates than desktop users?
- What specific content correlates with a transition from "new" to "returning" user?
5. New vs. Returning User Dynamics
Treat "New" and "Returning" as distinct cohorts. If your ratio of new users is high but returns are low, your acquisition strategy is working, but your retention strategy is failing. Conversely, a high volume of returning users suggests brand loyalty, which you can leverage for upselling and personalization.
Understanding the Limitations
Even the most sophisticated tracking has boundaries. Analysts must remain cognizant of these systemic limitations:
- Privacy-First Browsing: As browsers prioritize user privacy, the accuracy of tracking decreases, leading to potential "gaps" in user data.
- Cross-Device Attribution: Without a User ID (a system where you log users in and assign them a permanent ID), tracking a single human across a phone, tablet, and laptop is technically impossible.
- Sampling: In large datasets, Google may use data sampling to provide reports quickly. This can lead to slight discrepancies in precision.
- Ad-Blockers: Users with aggressive privacy settings or ad-blocking software may be invisible to GA4 entirely, skewing your perception of total reach.
Implications for Digital Strategy
The shift toward "Active Users" over "Unique Visitors" is not merely a change in nomenclature; it is a shift in philosophy. Google is encouraging businesses to focus on engagement.
In the past, the goal was to drive as much traffic as possible. Today, the goal is to drive meaningful traffic. If your marketing campaign brings in 10,000 visitors, but only 100 of them trigger an engagement event, your strategy is inefficient. By focusing on Active Users, you align your KPIs with the actual health of your digital presence.
Conclusion: Moving Toward Actionable Insights
Understanding GA4’s user metrics is about moving from "what" happened to "why" it happened. By mastering the distinction between total and active users, recognizing the limitations of Client ID tracking, and applying robust segmentation, you can transform your analytics dashboard from a list of confusing numbers into a strategic roadmap.
Ultimately, your analytics platform is only as good as the questions you ask of it. Start by auditing your current setup, cleaning up your event triggers, and focusing on the behavior of your most loyal, engaged segments. As you continue to monitor your data, remember that the numbers are an approximation—but when used correctly, they are the most powerful tool you have to optimize the user experience and drive sustainable business growth.
Have questions about your GA4 configuration or struggling with specific user metrics? Share your experiences in the comments below to join the discussion with our expert community.
