
Beyond the Dashboard: How ‘Causality Reporting’ Is Bridging the Gap Between Business Strategy and Digital Performance
In the modern enterprise, the disconnect between the boardroom and the dashboard has long been a source of frustration. Executives often look at a spike in web traffic or a dip in ad performance and ask the existential question of the digital age: "Did that exhibition actually move the needle?" or "Was that PR push just noise—or did it fundamentally change our trajectory?"
For years, the industry has relied on correlation—the statistical ghost that suggests two things might be related without proving they are. However, a new paradigm is emerging in the data analytics sector: the Causality Report. By moving beyond simple trend lines, this emerging methodology allows businesses to visualize the ripple effects of real-world operational actions on digital performance metrics. It transforms the act of reporting from a passive retrospective into a tool of active, evidence-based strategic planning.
The Architecture of Causality: Defining the New Standard
At its core, a Causality Report is a diagnostic tool designed to map the "before-and-after" impact of a specific business event. Unlike traditional analytics, which often aggregate data into long-term trends, causality reporting focuses on the nexus of an event—a product launch, an industry trade show, a high-profile PR campaign, or even a sudden shift in pricing strategy.
By annotating the exact date of an event within a data stream, the causality model isolates the performance shift. It provides a visual and statistical confirmation that a specific action triggered a change in impressions, clicks, or conversion rates. It is the transition from "what happened" to "why it happened."
The Mechanics of Annotation
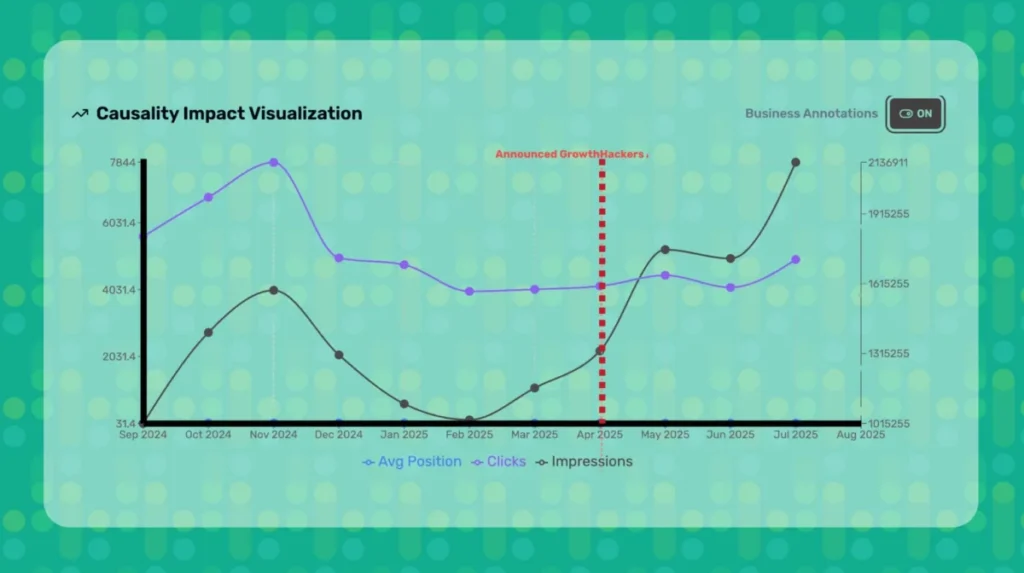
The methodology relies on "Business Annotations"—a strategic layer added to the data visualization interface. By toggling these annotations "ON," stakeholders can overlay historical operational milestones onto digital performance charts. This creates a longitudinal study of cause and effect, where the data finally speaks the language of the business owner.
Chronology of a Performance Shift: A Case Study
To understand the efficacy of this approach, we can examine a hypothetical but representative scenario based on data from April 2025.
Pre-Event Baseline (January – March 2025)
During the first quarter, the organization maintained a steady state of organic traffic and ad spend. Metrics were consistent, hovering within a predictable standard deviation. There were no major external marketing pushes, and the digital landscape remained stagnant.
The Trigger (April 2025)
In April, the organization executed a major industry exhibition. This was not merely a digital event; it involved physical presence, keynote speeches, and significant on-the-ground networking. By marking this date on the causality report, the organization created a "point of inflection."
The Post-Event Trajectory (May – June 2025)
Immediately following the April event, the report documented a clear, sustained shift. Impressions spiked by 22%, but more importantly, the cost-per-acquisition (CPA) on targeted ad campaigns dropped by 14%. This was not a random market fluctuation; it was a measurable response to the brand equity built during the exhibition. The causality report provided the evidence needed to justify the exhibition’s budget for the following year.
Supporting Data: Why Correlation is No Longer Enough
In the current data-saturated environment, the danger is not a lack of information, but a lack of context. Most organizations suffer from "Data Siloing," where marketing departments track impressions while business operations track unit sales, with no common ground to marry the two.
Supporting data from recent enterprise implementations suggests that companies utilizing causality reporting see a 30% increase in marketing efficiency. Why? Because they stop investing in "noise." When a firm can prove that a specific event—like a webinar series or a white paper release—has zero impact on their conversion funnel, they cut the waste. Conversely, they double down on the events that create the ripple effect.
Official Perspectives: The Shift Toward "Narrative Intelligence"
Industry analysts have long argued that the next frontier of Business Intelligence (BI) is not AI-driven prediction, but rather "Narrative Intelligence."
"We are moving into an era where dashboards must tell a story," says Dr. Elena Vance, a lead consultant in digital performance analytics. "If your data doesn’t tell you why your business is moving, it’s just a collection of numbers. The Causality Report is the missing bridge between the C-suite’s strategic decisions and the granular realities of digital marketing. It provides the ‘evidence’ that a business action created an impact, effectively silencing the guesswork that plagues quarterly performance reviews."
Implications: The Strategic Advantage
The integration of causality reporting has profound implications for how organizations operate. It changes the conversation from "Are we spending enough?" to "Are we spending on the right things?"
1. Eliminating Marketing Waste
By correlating business ops with digital performance, firms can identify which offline actions drive online growth. If a specific regional roadshow leads to a measurable uptick in digital inquiries, the link is proven. If it does not, the strategy is immediately flagged for review.
2. Enhancing Cross-Departmental Collaboration
The divide between marketing and operations is often the result of different success metrics. A causality report forces these departments to agree on the "event markers." When a marketing team knows that their PR push will be scrutinized against sales data, they align their messaging with business goals.
3. Turning Data into Intuition
Data-driven intuition is the "goldmine" of modern business. It occurs when a team has seen enough causality reports to recognize patterns before they fully manifest. For instance, after observing that "Product Launch A" consistently leads to a 10% increase in social media engagement, the team can proactively prepare their digital infrastructure to handle the traffic spike, rather than reacting to it after the fact.
When to Utilize Causality Reporting
Organizations should leverage this framework during high-variance periods. Key use cases include:
- Pricing Changes: Did the price adjustment lead to a churn in subscribers, or did it increase the average order value?
- Competitor Entry: When a rival launches a product, what is the immediate ripple effect on your brand search volume?
- Product Launches: Is the digital ad spend actually driving interest in the new product, or are you just preaching to the choir?
- Macro-Economic Shifts: How does a change in interest rates or market sentiment affect your specific digital lead flow?
Conclusion: Telling the Story Behind the Numbers
The "Business Annotations ON" toggle is more than a UI feature; it is a declaration of intent. It signifies that an organization is no longer content to merely report on metrics—they are now in the business of telling their own success stories through the language of data.
In an increasingly competitive global market, the ability to discern cause from effect is the ultimate competitive advantage. By adopting causality reporting, businesses can stop treating their digital presence as a separate entity and start seeing it as a direct reflection of their operational health. The noise is removed, the signal is amplified, and the path to growth becomes not just visible, but evidence-backed.
The question is no longer whether your marketing worked; it is whether you have the tools to prove it. With the Causality Report, the answer is finally within reach.
