

Decoding Social Success: The Definitive Guide to Engagement Rate Benchmarks and Formulas for 2026
In the fast-evolving landscape of digital marketing, "vanity metrics"—such as total follower counts—are increasingly taking a backseat to the heartbeat of social media: Engagement Rate. As social algorithms prioritize meaningful interactions over simple visibility, understanding how to measure, analyze, and optimize engagement has become a non-negotiable skill for brands and creators alike.

With over 1 million posts analyzed by data science agency Critical Truth in partnership with Hootsuite, we now have a clearer picture of what "success" looks like across the digital ecosystem in 2026. This guide explores the mechanics of engagement, the formulas that define it, and the industry-specific benchmarks you need to calibrate your 2026 strategy.

What is Engagement Rate and Why Does It Matter?
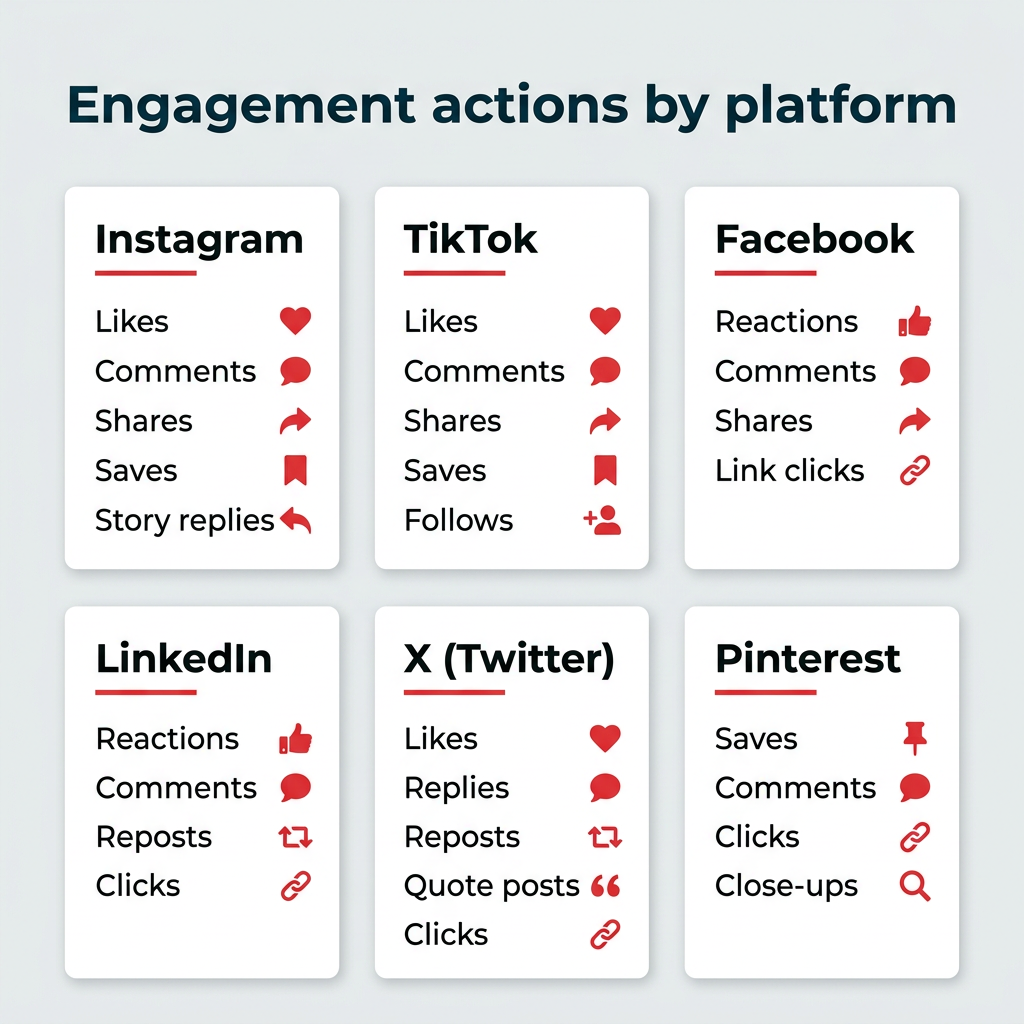
At its core, engagement rate is the primary metric used to determine how effectively a brand’s content resonates with its target audience. It measures the volume of interactions—likes, comments, shares, saves, and clicks—relative to the total reach or audience size of a specific post, campaign, or account.
The Strategic Importance
Engagement rate serves as a critical pulse check for three primary reasons:
- Content Validation: High engagement signals that your content is not just being seen, but consumed and valued. It validates your creative direction and helps identify which topics or formats (e.g., video vs. static) trigger audience action.
- Algorithmic Favorability: Social media algorithms are designed to maximize time-on-platform. By surfacing content that generates active conversations and shares, algorithms reward high-engagement posts with increased reach, often pushing your brand in front of non-followers.
- Proof of ROI: For enterprise teams, engagement is the strongest indicator of "earned" value. It transforms abstract impressions into concrete behavioral data, allowing teams to demonstrate the tangible return on social media investments to stakeholders.
Chronology of Engagement: From Passive Views to Active Interaction
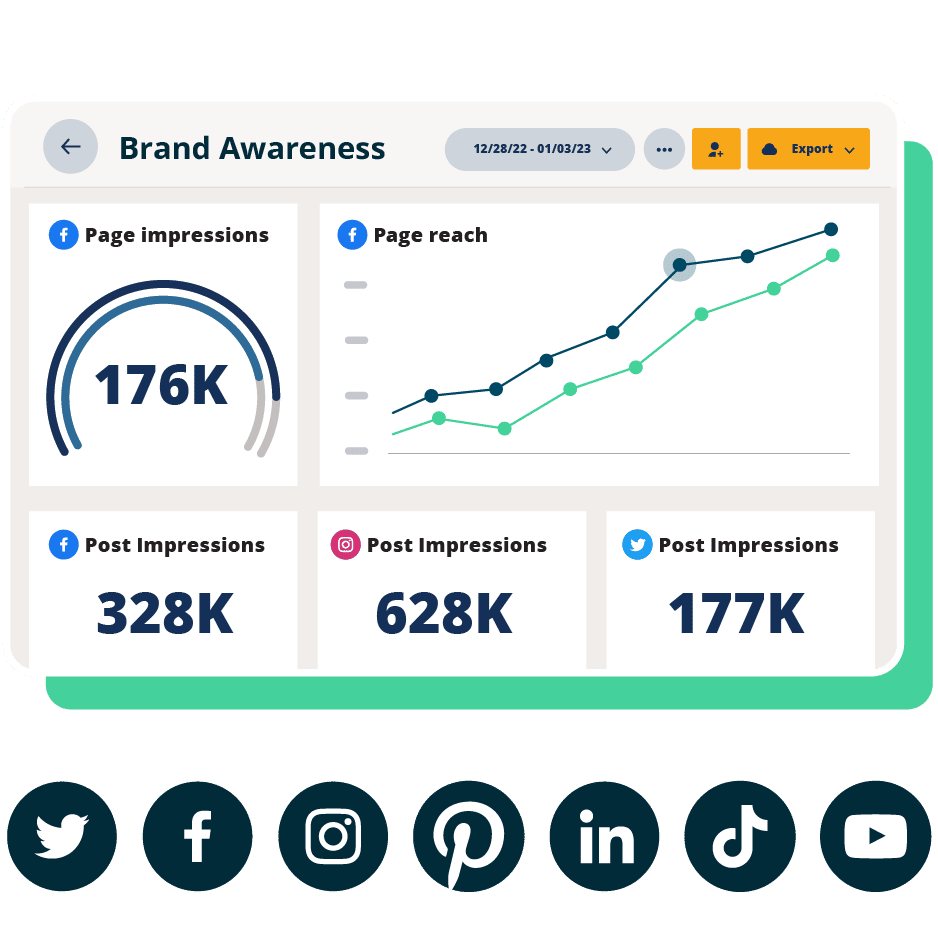
Social media measurement has shifted significantly over the last decade. Historically, brands relied heavily on "impressions" or "reach"—the number of times a piece of content appeared on a screen. However, as users became more discerning, these "passive" metrics lost their predictive power.
- The Early Days (2010–2015): Focus was on "community size." Brands chased follower growth as the primary KPI.
- The Pivot to Depth (2016–2020): With the rise of influencer marketing, the industry realized that 100,000 followers mean little if only 100 people engage. The focus shifted to "Interaction Rate."
- The Algorithmic Era (2021–Present): The rise of TikTok and Instagram Reels forced a complete re-evaluation. Today, metrics like "Saves" and "Shares" (high-intent actions) are prioritized over "Likes" (low-intent actions) by most platform algorithms.
Today, successful social teams no longer view engagement as a singular number. They view it as a multi-layered ecosystem that accounts for different user intents across platforms.
The Six Essential Formulas for Calculating Engagement
Not all engagement is created equal. Depending on whether you are analyzing a viral video, a paid ad campaign, or long-term brand health, you should employ different mathematical models.

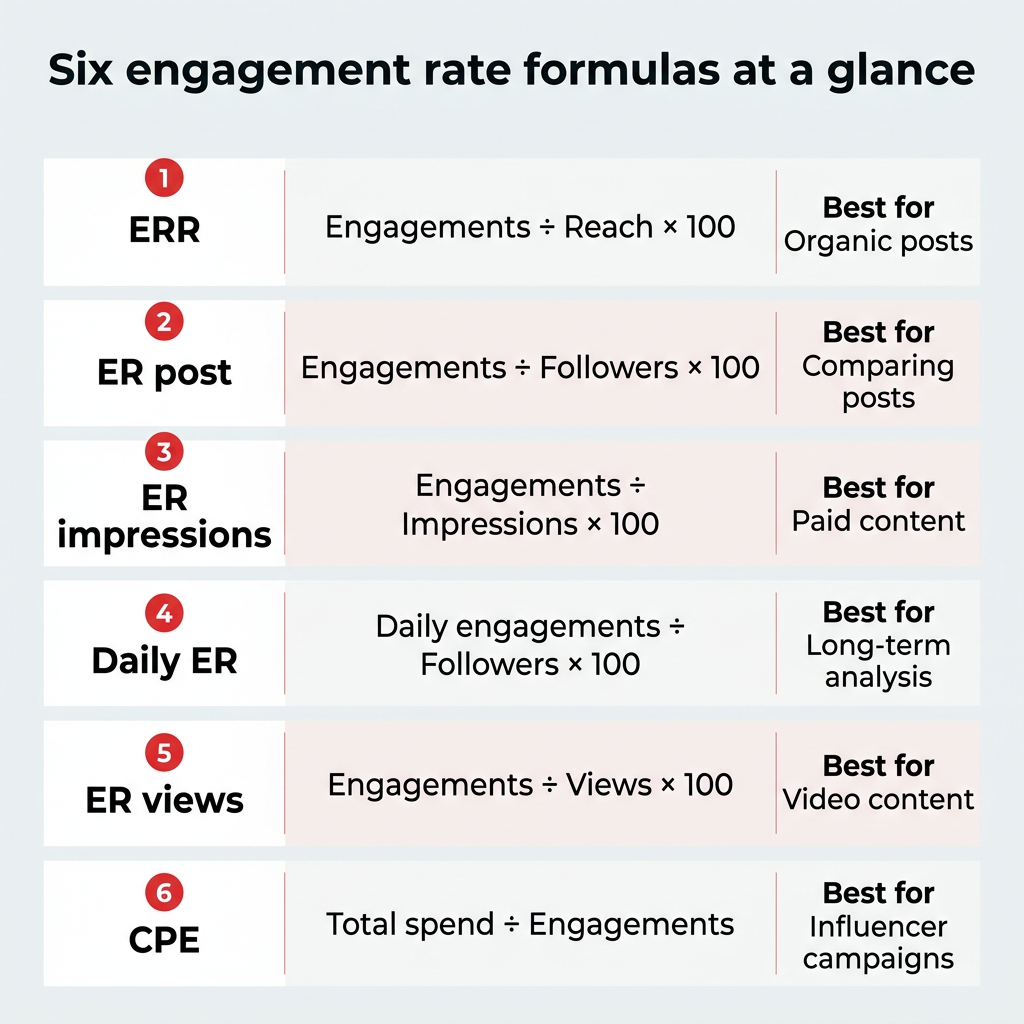
1. Engagement Rate by Reach (ERR)
- Formula: (Total Engagements / Total Reach) * 100
- Why use it: This is the most accurate metric for organic content. It tells you exactly how many people who actually saw your post decided to interact with it.
2. Engagement Rate by Post (ER Post)
- Formula: (Total Engagements / Total Followers) * 100
- Why use it: This is the gold standard for comparing the performance of one post against another. It creates a stable baseline, especially for influencers.
3. Engagement Rate by Impressions (ER Impressions)
- Formula: (Total Engagements / Total Impressions) * 100
- Why use it: Essential for paid advertising. Since impressions count every time a screen displays your ad, this helps determine if your creative is fatiguing.
4. Daily Engagement Rate (Daily ER)
- Formula: (Total Engagements in a Day / Total Followers) * 100
- Why use it: Captures the "always-on" nature of your account. It tracks how often followers interact with your brand on a daily basis, regardless of when the post was published.
5. Engagement Rate by Views (ER Views)
- Formula: (Total Engagements / Total Video Views) * 100
- Why use it: The go-to for video-first platforms like TikTok and Reels, where views are the primary metric of exposure.
6. Cost Per Engagement (CPE)
- Formula: (Total Amount Spent / Total Engagements)
- Why use it: Crucial for finance and marketing teams to understand the monetary cost of driving an interaction.
2026 Industry Benchmarks: A Data-Driven Reality Check
To know if you are winning, you must know the average. Based on the 2026 analysis of 1 million+ posts, here is the baseline for success across industries.
Platform-Wide Averages (All Industries)
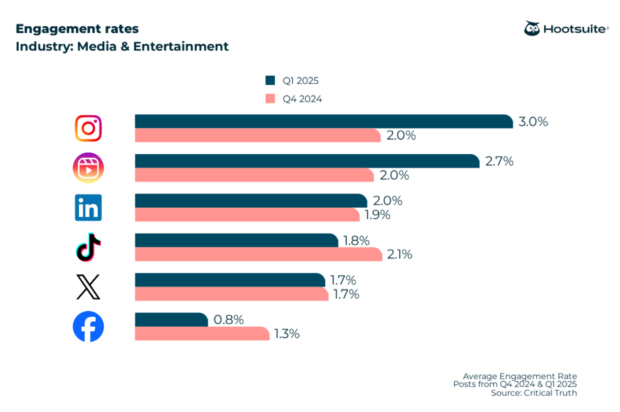
- Instagram: 3.0%
- Instagram Reels: 2.7%
- LinkedIn: 2.0%
- X (formerly Twitter): 1.8%
- TikTok: 1.5%
- Facebook: 0.8%
Industry-Specific Snapshots
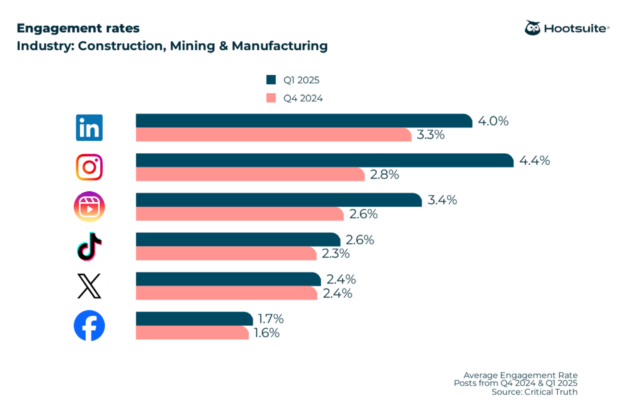
- Nonprofit & Construction/Manufacturing: These sectors often see surprisingly high engagement on Instagram (up to 4.4%), likely due to the visual storytelling power of their missions and product demonstrations.
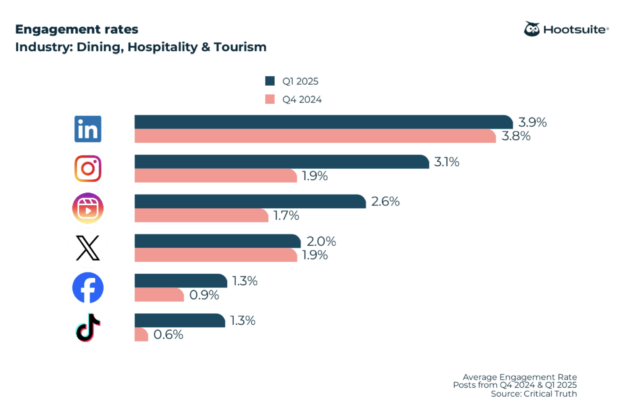
- Finance: Shows strongest performance on Instagram at 3.8%, proving that even "dry" industries can thrive with high-quality visual education.
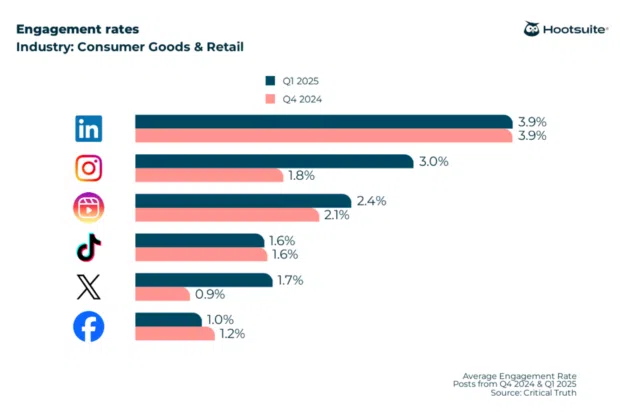
- Consumer Goods & Retail: LinkedIn has emerged as a powerhouse here (3.9%), suggesting that B2B retail conversations are driving more meaningful engagement than B2C posts on other platforms.
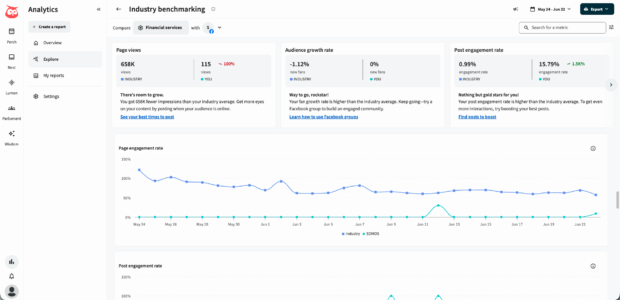
Official Perspective: The Role of Analytics Tools
Industry leaders like Hootsuite emphasize that manual calculation is a recipe for error. "For enterprise teams managing multiple accounts, the complexity of platform-specific definitions—where a ‘like’ on Facebook might be weighted differently than a ‘share’ on LinkedIn—makes manual spreadsheets unsustainable," says the company’s analytical research team.
Using integrated analytics tools like Perch by Hootsuite allows teams to:
- Automate Reporting: Remove the human element of manual calculation.
- Trend Analysis: Compare engagement rates against previous quarters to measure growth.
- Predictive Scheduling: Identify exactly when your specific audience is most active to maximize the potential for engagement.
Implications for Your 2026 Strategy
As we look toward the remainder of 2026, the implications of these findings are clear:
- Quality over Quantity: Because reach is increasingly expensive or hard to come by, brands must prioritize high-value content that encourages "shares" and "saves." These actions carry more weight in current algorithms than a simple "like."
- Platform Specialization: Don’t use a "one-size-fits-all" approach. If your Facebook engagement is lagging at 0.8%, don’t double down on it; pivot your strategy to where your engagement is highest—likely Instagram or LinkedIn—and tailor your content for those audiences.
- The "Community" Factor: Engagement isn’t just about the numbers; it’s about the conversation. Brands that reply to comments and spark dialogue within their threads see a compounding effect on their engagement rates.
- Data-Backed Planning: Move away from "gut feeling." If the data shows that Reels generate a 2.7% engagement rate while static posts on Facebook generate 0.8%, your content calendar should reflect a heavy tilt toward video.
Conclusion
Engagement rate is not just a vanity metric; it is the definitive measure of your brand’s digital health. By moving beyond total follower counts and focusing on the specific formulas and benchmarks relevant to your industry, you can turn your social media presence from a megaphone into a two-way conversation. Use these 2026 benchmarks to set your goals, leverage automated tools to track your progress, and continue refining your content until you consistently outperform the industry average.
