
Decoding Digital Footprints: A Comprehensive Guide to Unique Visitors in Google Analytics 4
Last Modified: March 26, 2025
In the intricate world of web analytics, the sheer volume of metrics can often feel overwhelming. From "Total users" and "Active users" to "New users," "Returning users," and "sessions," digital marketers and analysts are constantly navigating a complex landscape of data points. This abundance, while offering granular insights, frequently leads to confusion regarding precise definitions and their implications for meaningful analysis. Understanding the nuances of each metric, particularly the critical concept of "unique visitors," is paramount for accurate performance measurement and strategic decision-making.
This comprehensive guide delves into the specifics of user identification within Google Analytics 4 (GA4), Google’s latest analytics platform. We aim to clarify common misconceptions, detail GA4’s unique approach to user measurement, and equip readers with best practices for leveraging this vital data effectively.
Understanding the Evolving Landscape of Web Analytics Metrics
The journey of web analytics has been one of continuous evolution, moving from rudimentary "hits" in the early days to increasingly sophisticated, user-centric measurements. This paradigm shift reflects the growing complexity of user behavior across devices and the imperative for businesses to understand individual customer journeys rather than mere traffic volumes. GA4, with its event-based data model, represents a significant leap in this evolution, departing from its predecessor, Universal Analytics (UA), in fundamental ways. This new approach, while powerful, redefines many familiar metrics, making a clear understanding of terms like "unique visitors" more crucial than ever.
The Core: Defining Unique Visitors in GA4
At its heart, a "unique visitor" conceptually refers to an individual who visits a website or app, counted only once within a specified time frame, regardless of how many times they return during that period. This metric is foundational for gauging audience size and reach.

Main Facts: GA4’s Approach to User Identification
A critical distinction in GA4 is the absence of a direct "unique visitor" metric as it was known in Universal Analytics. Instead, GA4 introduces two primary user identifiers: Total users and Active users. While both aim to represent unique individuals, they do so with subtly different criteria, reflecting GA4’s emphasis on user engagement.
- Total Users: Google defines "Total users" as the count of unique users who trigger any event on the site or app within a specified date range. Since GA4 is entirely event-driven, even a basic
page_viewevent (which fires when a user loads a page) is sufficient to register a unique user. Custom events, tailored to specific business objectives (e.g.,sign_upupon form submission), also contribute to this count once their trigger conditions are met. - Active Users: This metric signifies unique users who have engaged with your website or app during a specified date range. The concept of "engagement" is central to GA4 and represents a more meaningful interaction than simply landing on a page. Active users are the default "Users" metric displayed in many standard GA4 reports, indicating Google’s preference for engagement-focused insights.
Chronology: The Transition from Universal Analytics to GA4
The shift from UA to GA4 brought about a fundamental re-evaluation of how users are tracked and defined. Universal Analytics primarily relied on "Unique Visitors" (identified by a Client ID stored in a cookie) and "Sessions" as its core metrics. This session-based model often struggled with accurately tracking users across different devices or providing a holistic view of the customer journey, especially as privacy concerns grew and cross-device usage became ubiquitous.
GA4, launched to address these limitations, adopted an event-centric data model. Every interaction is an "event," and users are identified through a blend of methods designed for a more comprehensive and privacy-resilient approach. This evolution necessitated the introduction of "Total Users" and "Active Users" to better reflect user behavior in this new framework, with "Active Users" emphasizing quality of interaction over mere presence.
Supporting Data: Deconstructing GA4’s User Metrics
The difference between "Total Users" and "Active Users" lies in the definition of "engagement."
A user is considered "engaged" in GA4 if they meet any of the following conditions within a session:

- The session lasts longer than 10 seconds.
- The user triggers one or more conversion events.
- The user views two or more pages or screens.
Furthermore, a specific event, user_engagement, is automatically collected by GA4 when a webpage is in focus or an app is in the foreground for at least one second. While Google’s official documentation states this one-second threshold, practical observations suggest the user_engagement event often fires either just before a user navigates to a new page or after a more extended stay (e.g., over 10 seconds) on the same page. This subtle distinction highlights the complexity inherent in defining engagement programmatically.
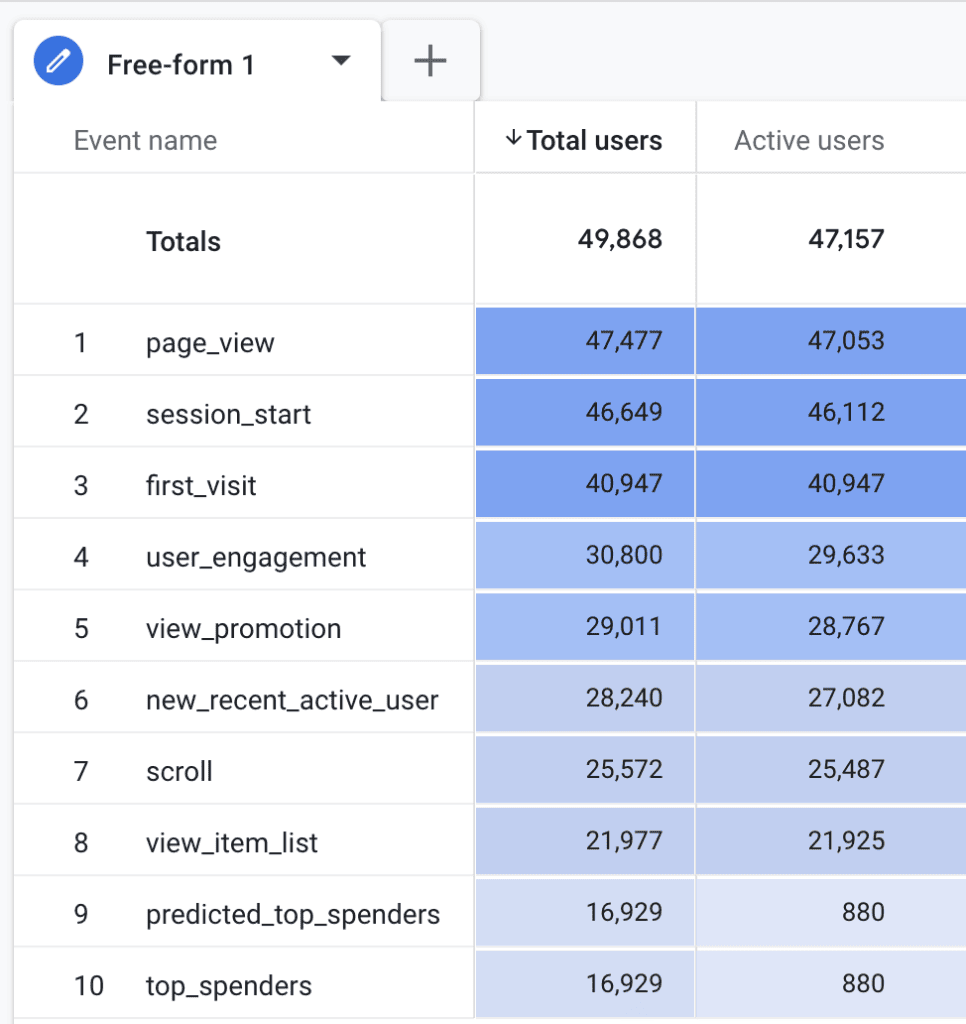
Given these definitions, it’s common for "Total users" and "Active users" to show similar numbers in many reports, as most users performing any event will likely also meet the criteria for an engaged session. The following comparison illustrates this typical proximity:
(Self-correction: I cannot insert an image, so I will describe it)
Image description: A chart comparing "Total users" and "Active users" over time in GA4, showing consistently close values, with "Total users" typically slightly higher or equal to "Active users."
It’s also important to understand other user categories:
- New Users: Users who interact with your site or app for the first time.
- Returning Users: Users who have previously interacted with your site or app.
A crucial nuance here is that a single individual can be counted in both "New Users" and "Returning Users" metrics within a selected date range. For instance, if a user visits on March 2nd (making them "new") and then again on March 7th, within a date range of March 1st to March 10th, they will contribute to both counts. Therefore, summing "New Users" and "Returning Users" will not accurately reflect the total unique individuals.
In many standard GA4 reports, when you see "Users" listed, it typically refers to "Active users." This design choice underscores Google’s focus on quality interactions over simple page views.
The Mechanics of User Tracking: How GA4 Identifies Individuals
Accurate user identification is the backbone of web analytics. GA4 employs a multi-faceted approach to stitch together user journeys across various touchpoints.
Official Responses: Google’s Identity Resolution Model
Google utilizes several methods to identify users in GA4, forming a robust identity resolution model:
-
Client ID (CID): This is the primary, foundational identifier. A unique, randomly generated "Client ID" (CID) is stored in a first-party cookie named
_gain the visitor’s browser. This ID allows GA4 to distinguish between new and returning users on the same device and browser. The_gacookie, by default, has a 2-year expiration time. However, this can be adjusted within the GA4 interface (up to 25 months, or as low as 0 for session-end expiry) to comply with regional privacy regulations. Importantly, privacy-focused browsers (e.g., Safari with Intelligent Tracking Prevention – ITP) can impose stricter limitations, sometimes reducing cookie lifespan to 7 days or even 24 hours, which can inflate "new user" counts as the same person might be assigned a new Client ID. The Client ID typically looks like1242591205.1741664478, where the first part is random and the second is the UNIX timestamp of the cookie’s creation. -
Beyond Client ID: Holistic User Identification: While Client ID is crucial, it’s limited to a single browser and device. To offer a more holistic, cross-device view, GA4 integrates other identity signals:
- User-ID: If implemented, this is a persistent, non-personally identifiable ID assigned by your own authentication system (e.g., when a user logs in). It’s the most accurate method for identifying users across devices and sessions.
- Google Signals: If enabled, this leverages data from users who are signed into their Google accounts and have opted into Ads Personalization. Google Signals can help de-duplicate users across devices by linking their activity through their Google account.
- Device ID: For mobile apps, GA4 utilizes the device’s unique identifier (e.g., Android Advertising ID or iOS Identifier for Advertisers – IDFA) to track users.
This layered approach to identity resolution allows GA4 to offer more comprehensive user insights, though the accuracy ultimately depends on the implementation of User-ID and user consent for Google Signals. It’s crucial to remember that Client ID is not a User-ID; a Client ID cannot track users across different browsers or devices, and its deletion (either by the user or browser) will result in a new "new user" being counted on their next visit. Similarly, ad blockers that prevent cookie storage can hinder tracking altogether.
Navigating GA4 Reports: Locating User Data
GA4 provides numerous entry points to access user metrics, both in its standard reports and through the more flexible "Explorations" interface. While "Active users" is often the default, "Total users," "New users," and "Returning users" are also readily available.
Supporting Data: Where to Find User Metrics
Here’s a comprehensive list of standard GA4 reports where you can find various user metrics:
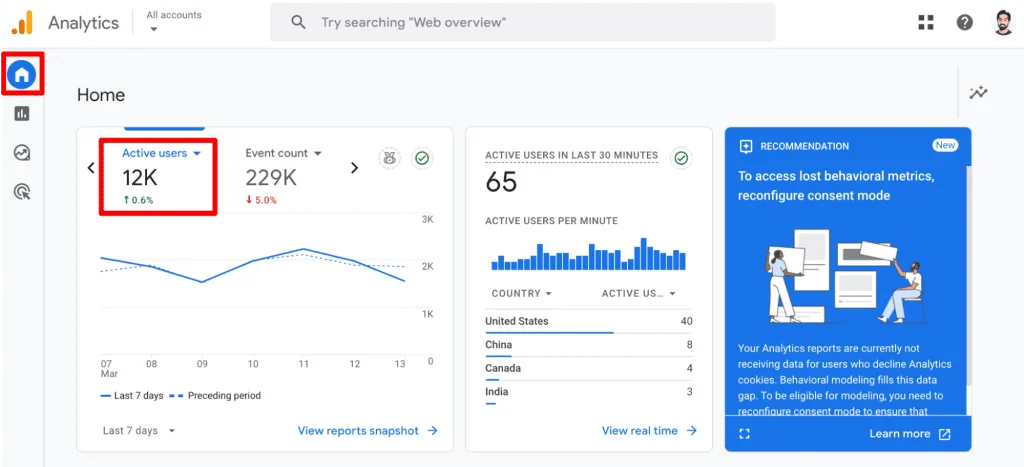
- Home: Displays "Active users" compared to the previous period.
- Reports snapshot: Offers quick overviews of "Active users" and "New users."
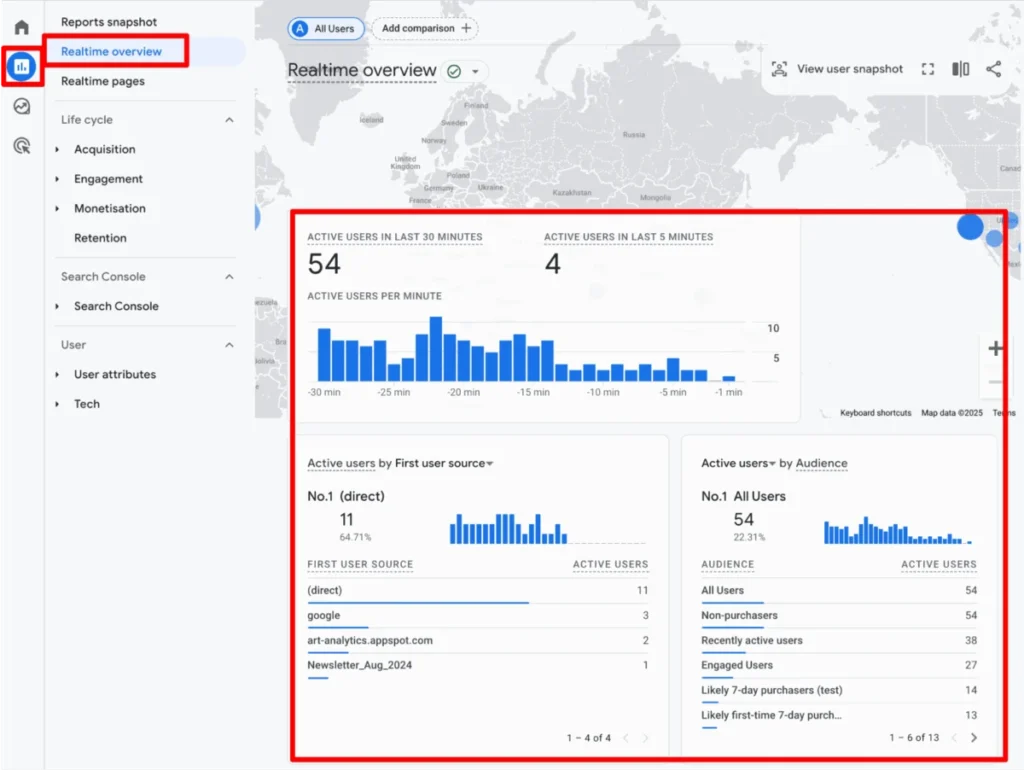
- Realtime overview: Shows "Active users" in the last 30 minutes, providing immediate insights into current site activity.
- Realtime pages: Similar to the overview, but lists pages currently being viewed by "Active users."
- Acquisition Overview cards: Presents "Active users" and "New users" by source.
- User acquisition: Details "Total," "New," and "Returning users" by their initial acquisition source.
- User acquisition cohorts: Focuses on "New users" and their retention over time.
- Engagement Overview cards: Features "Active users" and key engagement metrics.
- Events: Provides "Total users" who triggered specific events.
- Pages and Screens: Shows "Active users" interacting with specific content.
- Landing pages: Displays "Active users" and "New users" arriving on specific landing pages.
- eCommerce Purchase and Checkout journey: Tracks "Active users" through critical conversion funnels.
- Retention: Analyzes "New" and "Returning users" to gauge loyalty and churn.
- User attributes Overview cards: Summarizes demographic data for "Active users."
- User attributes Demographic details: Provides "Active users" and "New users" by demographic categories.
- User attributes Audiences: Details "New" and "Total users" within defined audience segments.
- Tech Overview cards: Shows "Active users" by technology used (browser, device, OS).
- Tech details: Provides "Active users" and "New users" by specific tech dimensions.
For more customized analysis, GA4’s "Explorations" feature is invaluable. Here, analysts can drag and drop dimensions and metrics to build bespoke reports. All user metrics are available, though some may be disabled if they are incompatible with selected dimensions, ensuring data integrity.
(Self-correction: I cannot insert an image, so I will describe it)
Image description: A screenshot of GA4’s "Explorations" interface, highlighting the "Metrics" section where various user metrics like "Active users," "New users," "Total users," and "Returning users" are listed, ready to be added to a custom report.

Strategic Application: Best Practices for Actionable Insights
Simply finding user data is only the first step. The true value lies in how this data is interpreted and applied to inform business strategy.
Implications: Maximizing the Value of User Data
- Ensuring Data Integrity Through Correct Setup: The accuracy of your user metrics hinges on a pristine GA4 implementation. Common issues include duplicate tracking (e.g., GA4 installed directly and also via Google Tag Manager), which can inflate event counts and distort user behavior patterns. Regular audits of your tracking setup and a structured process for making changes are essential to prevent data discrepancies.
- Proactive Data Monitoring and Anomaly Detection: Regularly monitoring user metrics for sudden dips or spikes can signal critical issues (e.g., tracking breakdown, bot traffic, successful campaign) or opportunities. GA4’s "Custom Insights" feature allows you to set up alerts for significant changes, with email notifications ensuring you stay informed even without constant dashboard vigilance.
- Understanding Aggregation: The Peril of Summing Users: User metrics in GA4 are already aggregated; they represent unique counts within the selected timeframe. Attempting to sum user counts across different dimensions (e.g., adding daily user counts to get weekly users) will lead to inflated and inaccurate totals. If a user visits on Monday and again on Wednesday, they are counted as one unique user for the week, but two if you sum daily unique users. For precise, granular user-level analysis that avoids this pitfall, tools like BigQuery (where you can access the
user_pseudo_id) are necessary. - Strategic Segmentation for Deeper Insights: Segmenting your user data is crucial for moving beyond surface-level numbers. By applying segments based on demographics, traffic sources, device types, or behavioral patterns, you can answer questions like:
- Which traffic sources bring the most engaged or converting users?
- Are mobile users behaving differently from desktop users?
- Does consumption of specific content types correlate with higher conversion rates?
Segmentation empowers you to identify your most valuable user groups and tailor experiences to optimize their journey.
- Differentiating New vs. Returning Users for Tailored Strategies: Understanding the balance and behavior of new versus returning users is fundamental for marketing and product strategy.
- High New Users, Low Returning: Indicates strong acquisition but weak retention. Strategies should focus on improving the initial user experience, implementing email marketing, remarketing campaigns, or personalization to encourage repeat visits.
- High Returning Users, Low New: Suggests robust customer loyalty and retention but potentially weak acquisition efforts. Focus on optimizing acquisition channels, expanding reach, or exploring new markets. For returning users, strategies could include loyalty programs, exclusive offers, or upselling opportunities.
It’s important not to sum these two metrics to match total users, as a single user can be both "new" (on their first visit within a period) and "returning" (on subsequent visits within the same period). Their separate analysis provides distinct strategic guidance.
These best practices ensure that your analysis of unique visitor data is not only accurate but also actionable, contributing directly to informed decision-making and business growth. They also lay the groundwork for reliable A/B testing, ensuring that experiment results are based on solid user counts.
Acknowledging the Nuances: Limitations of GA4 User Data
Despite GA4’s advancements, it’s crucial to acknowledge the inherent limitations of unique user data in any digital analytics platform. These nuances can influence data accuracy and must be considered when drawing conclusions.
Implications: The Inherent Imperfections of Digital Measurement
- Privacy-Driven Discrepancies: The increasing focus on user privacy, manifested through browser privacy features (like Apple’s ITP), ad blockers, and cookie consent regulations (GDPR, CCPA), significantly impacts user tracking. When cookies are blocked, deleted, or have a shortened lifespan, a single user may be assigned a new Client ID on subsequent visits, artificially inflating "new user" counts and total user numbers. Users opting out of analytics cookies will not be tracked at all.
- Data Thresholds: To protect user privacy, GA4 applies data thresholds. If the number of users in a report is too low, Google may suppress certain data points (e.g., demographic information) to prevent individuals from being identified. This can impact the completeness of certain segmented reports, particularly for smaller websites or niche segments.
- Identity Resolution Model Complexities: While GA4 attempts a more holistic identity resolution using Client ID, User-ID, Google Signals, and Device ID, it’s not foolproof. Without a robust User-ID implementation (requiring user logins), a single individual using multiple devices or browsers may still appear as separate "users." The accuracy of cross-device tracking heavily relies on Google Signals and user consent, which are not universally available.
- Data Sampling: For very large datasets, particularly in custom reports or "Explorations," GA4 may employ data sampling to process reports faster. This means that instead of analyzing 100% of your data, GA4 analyzes a subset and extrapolates the results. While often representative, sampled data is an approximation and can introduce minor inaccuracies, especially for highly specific or small segments.
- Discrepancies Across Reports: Minor differences in user counts can sometimes occur between different GA4 reports. This can be attributed to various factors, including data processing delays, different aggregation methods, or specific report filters. While generally negligible for high-level analysis, it’s a point to be aware of for highly granular comparisons.
- The "Approximation" Factor: Ultimately, all user counts in GA4, like any web analytics tool, are approximations. The dynamic nature of user behavior, combined with technological and privacy constraints, means that achieving a perfectly "true" count of unique individuals is virtually impossible. The goal is to obtain the most consistent and reliable data possible within these limitations to identify trends and make informed decisions.
Understanding these limitations is not an admission of defeat but rather a crucial aspect of data literacy. It enables analysts to interpret insights with appropriate context and communicate the inherent nature of digital measurement accurately.
Summary
This guide has thoroughly explored the concept of "unique visitors" within the Google Analytics 4 framework. We’ve navigated the evolution from Universal Analytics, clarified GA4’s core user metrics – "Total users" and "Active users" – and delved into the nuanced definitions of engagement that differentiate them. We also examined the role of "New users" and "Returning users" and the pitfalls of their summation.

We detailed Google’s identity resolution mechanisms, primarily the Client ID and its supporting signals, and highlighted the impact of privacy regulations and browser technologies on tracking accuracy. Furthermore, we provided an extensive list of GA4 reports where user metrics can be found, emphasizing the flexibility of "Explorations" for custom analysis.
Crucially, we outlined best practices for leveraging user data, from ensuring data integrity and proactive monitoring to the strategic importance of segmentation and correctly interpreting new versus returning user behavior. Finally, we addressed the inherent limitations of GA4 user data, including privacy constraints, data thresholds, and sampling, reinforcing the understanding that all digital analytics provide approximations rather than absolute truths.
For those looking to deepen their understanding of GA4’s engagement metrics, a companion resource, "GA4 User Engagement Made Visual and Simple," offers further insights into the user_engagement event and engaged sessions.
How do you utilize your unique visitor data in GA4? What challenges have you encountered, and what strategies have you found effective in overcoming them? Share your experiences and insights in the comments below to contribute to our collective understanding of this critical analytics domain.
